The solution is a one-page table with the main indicators of the advertising campaign "to keep your finger on the pulse". Designing a page like this will take you 10 minutes, but will save you many hours in the future. This is exactly what we have implemented for our clients.
What is Google DataStudio
This is a data visualization tool that allows you to upload data from different sources and bring it into online reports, and then share it in the best traditions of Google Docs.
- Key indicators, for example, a profit report in the context, social networks, etc., to "keep abreast".
- Medium depth, for example, a report on advertising campaigns or product categories in the context of Yandex.Direct.
- Deep, like cohort analysis or conversion by URL nesting, such reports need to be compiled manually.
So in Data Studio it is advisable to build reports only by key indicators.
At the time of writing, only beta is available with restrictions:
- Does not allow aggregating data from different sources, for example, take from Google Analytics the number of clicks on dates and reduce with the number of calls on the same dates from a regular spreadsheet in Excel.
- In our country, it is not yet possible to use the high technologies of Data Studio, so we will use ZenMate.
Ok, how to build such a dashboard in the end?
1. Install ZenMate. Follow the link and click "Install".

We click on the new icon in the browser and go to the registration page - register (the email can not be confirmed, and it works that way).

Click on the icon again and select Change location.

Change to United States.

2. Create a report
We go to home page data studio.
- Create a report- Google suggests using ready-made templates reports, but they are of little use, as they do not show our target indicators (profit, conversion, calls).
- Reports- Previously created reports.
- Data sources- Connected data sources, such as Google Analytics, MySQL, and so on, more details below.

Click on the blue plus sign and "agree" to the terms.

The New Report page opens and prompts you to create a new data source. Sample datasets are suggested as existing sources, but we don't need them.

As you can see, almost all popular sources are available, but we need Google Analytics.
The beauty is that you can link 2 different tools with one button, since they are inside your Google account.

- Options(in green) - these are utm_tags, regions, date, and so on, that is, we look at numerical indicators in the context of parameters.
- Indicators (Blue colour) is the number of clicks, conversions, revenue, and so on.

Let's try to create a new indicator, for example, we will create a synthetic indicator "Lead" from 4 goals according to the formula:
Target 1 * Target Weight + Target 2 * Target Weight + Target 3 * Target Weight + Target 4 * Target Weight
Lead = Calls (Goal 11 Completions) * 1 + Callbackhunter (Goal 3 Completions) * 0.9 + JivoSite (Goal 4 Completions) * 0.5 + Order (Goal 5 Completions) * 1.5

In the same way, we create a lead cost indicator and other familiar indicators, then these indicators can be changed and new ones can be added.
Lead Cost = Cost / Lead

The most popular parameters in Google Analytics
The most popular metrics in Google Analytics:
Building charts

After we have created the indicators, we go to the main workspace.
The first tool on the dashboard is the dates on which the report is built, we specify “Last 30 days (including today)” by default. That is, when someone opens your report, the date will be set by default.

Now let's build a regular graph with lines.

To the right of the tab Data see the settings available:
Data source- in one table there can be more than 1 source, for example, you can display data from several sources at once Google accounts Analytics for a manager or pull calls from Google Sheets.
Parameter: time parameter- e.g. Date.
Index- numerical values, for example, Sessions, you can display Income, Goals, Cost or your own indicators.
Initially, it can be misleading that the axes are superimposed on the same y-axis (vertical). To do this, you need to bind one axis to the left y-axis, and the other to the right.

Let's add the name of the graph using a text block:


Select the main indicators with a rectangle and move it to the background.

Let's add a filter to be able to filter the chart by sources. For example, if we uncheck yandex, then the graph and indicators will be displayed only by google.
Speaking of filters: in our case, we need data only for the "Contextual advertising" channel. To do this, you need to add a filter at the report level. Let's go to the menu Resource > Customize Filters and press Add filter


The filter works similarly to the filters in Google Analytics itself:
- Include/Exclude- We include traffic via the CPC channel in the report or exclude it from it.
- Select the Parameter/Indicator and set the condition, for example, the parameter Medium (traffic channel) = CPC (paid traffic type).
We will not dwell in more detail, since similar information can be found on the Internet.
Now click on any element that we want to filter. In the "Filter" field, click Add filter, where we choose our new filter Paid Traffic.

Let's add a table with conversion by region, for this we need to make a new indicator, as we did earlier. To do this, click Add indicator in the right panel and Create new.
Clicks > Leads = Leads / Sessions

And finally, let's make a table on the effectiveness of managers, since our Google Analytics would be integrated with AmoCRM, which allows you to upload sales to it.

In order not to confuse report users with the English names Cost, Revenue, and so on, they can be replaced with Russian ones. Finding the data source in the menu Resource > Added Data Sources and press Change.
How to give access?

We give access to view and place a link to our report with mixed data.

How to make more complex reports
Google Analytics has limitations in collecting and aggregating data, so we use the following scheme.

1. Uploading API data from Google Analytics, AdWords, Yandex.Direct, Yandex.Metrika, CRM and any other services to an application in the cloud.
2. Inside the Python application, we summarize the data into the tables we need and push it to Google BigQuery (we use it as a database).
3. Load from BigQuery into DataStudio. BigQuery is also easy to access from Pandas, Excel, and other popular tools.
Note that for all its flexibility, this is a complex solution.


Conclusion
In conclusion, let's compare the main solutions on the market that solve a similar problem.
| Microsoft Power BI | Google Analytics Dashboards | Google DataStudio | |
|---|---|---|---|
| Sources | Everything, but for the majority you need to write API integration | Only Google Analytics | 12 most popular |
| Auto update | You need to deploy a server in the cloud that will “push” fresh data | Automatically | Automatically |
| Difficulty of setting | High entry threshold | In the style of "grab and drag this icon here" | |
| Sharing | Yes | Difficult, only through Analytics | How Google Docs |
| Advantages | Suitable for complex projects for complex reports | Easy to connect as it is inside Analytics | Solves 80% of all problems |
26.04.2018 Reading time: 8 minutes
In the first articles of our series about contextual advertising we revealed the basic concepts of CR and found out how it works: this is the initial information, the minimum basics that are needed to present a more or less big picture. Today's third article goes into a slightly narrower specialization: we will tell you how to analyze contextual advertising.
Analysis of the effectiveness of contextual advertising: what tools to use
Yandex and Google have developed special analytical mechanisms for their systems - Yandex.Metrika and Google Analytics. These are special tools thanks to which the account owner can understand what happens on the site after the user clicks on the ad (the same analytics systems are also used in). They have system and functional differences, but regardless of which search engine you promote your campaigns in, you need to be able to set goals.
Let's start the review with the goals of Yandex.Metrica. This analytical tool Metrica takes into account all visits to the site - and it doesn’t matter where the user came from, but thanks to integration with Direct, you can get information about the KR. For it to be correct, you need to set goals. A goal is a specific user action that is expected in response to an advertisement.

An example of creating goals in Yandex.Metrica
You need to set goals right away, because they will be used to generate a report on the work of the CD and it is they that allow you to track the actions of visitors. For example:
- set the goal "Number of views" - we track and see in the report the number of visits during which certain pages were viewed;
- set the goal "Page visits" - we track whether a page or several pages of the site were visited, whether there were clicks on an external link, whether there was a click on a button Email and the file was downloaded;
- set the goal "JavaScript-event" - we track almost any arbitrary events on the site, in which the page address does not change: clicking on a button, filling out a form, the time the user spent on the page;
- we set a “Composite goal” - we track all of the above.
You can learn more about setting goals in Yandex.Direct in Yandex.Help.
After installing the Metrics counter on the page for which data is needed, data collection for the set goals will begin and a report will be generated.
What can be learned from the report?
- For which campaigns, advertisements, keywords and phrases, search users find your site and visit it, as well as in what region these users are located and from which advertising platform they went to your resource.
- Who is your audience: gender, age, interests, preferences are analyzed using Krypta technology.
- Did the campaign achieve its goals - did users behave as you expected: clicked on links, filled out forms, downloaded files, visited the required number of pages on the site, registered or subscribed to the newsletter, and so on.
- If you are the owner of an online store, then using Metrica you can get detailed information about the orders that were made on your site, as well as data on how much profit each order brought and where the orders with the highest price tag came from.
- Directly in the Metrika interface, you can estimate how much was spent on advertising, what is the average cost of conversions, what is the average or total cost per click for any region, query or site.
- Using the Target Call service, you can compare how effectively different promotion channels work: you, as the account owner, receive special phone numbers, link them to various sources, then the number on the website and in the virtual business card is automatically replaced according to the source - so you can find out from which channel the call came from.

What does a Yandex.Direct report look like from Yandex.Metrica?
Just like in Metrica, you get a report on the work of the CR in Google AdWords:

What a Google Analytics CR Report Looks Like
E-commerce from Google Analytics is more difficult to set up and richer in results than Yandex.Metrica.
There are two types of settings here: standard (as in Metrica) and advanced - the most interesting and rich in a wide variety of useful data. If, by setting up the standard version, we find out the data on orders and how much they cost, then the extended one will give us information about various user actions with goods, for example:
- clicks on product cards in the catalog and search;
- manipulation of items in the shopping cart (for example, adding or removing);
- detailed overview ordering and so on.
At the end of the term, you get two reports: "Ecommerce Review" and "Product Performance". They include:
- information about product revenues, conversion rates (more on them below);
- average number of items in a transaction;
- average cost of orders;
- refund information;
- the cost of goods, which allows buyers to add goods to the cart and checkout, and others.
Why is this type of e-commerce useful for online stores? Because these are essentially generalized characteristics of consumer behavior that help determine not only the further strategy of the online store's CR, but also understand what to invest in and what not; what is profitable and what is not. This is not just data on how much is sold and how much is earned, these are qualitative indicators that allow you to identify errors in work and save real money.
PPC KPIs
KPI (from the English key performance indicators) - key performance indicators of the CD. These are characteristics that give an understanding of how profitable CR is for business and how economically justified the budget is spent on this channel.
There are no templates for KPI and it is impossible to say what level of each indicator should be and what combination will be absolutely win-win. However, analyzing these metrics can help you spot problems and redirect your campaign in a profitable direction.
If trading data is set up, ROI can be seen in Google Analytics in the "Expense Analysis" report, "Traffic Source" section, "Return on Ad Investment" column.
PPC advertising management requires not only analytical but also creative skills. It is important not only to correctly analyze data from reports and compose relevant ad texts - you need to create interesting and attractive advertising campaigns for users. You can order contextual advertising of this level from us, write or call us!
We continue a series of publications on improving the lives of marketers and business representatives. Today we will analyze the connecting bridge between business and marketing - a monthly report on the effectiveness of advertising channels.
Why are reports needed?
- Reports help show the client how things work.
- Reports provide an opportunity to analyze your activities: what is effective and what is not, identify errors, determine the future path of work, and help set goals for the next period.
It would seem cool, you have to do it! But, alas and ah, not everyone gets their hands on it. After all, it is necessary to collect all the data from Yandex / Metrica, and view SEO tools, and upload statistics from the VKontakte advertising account, and there are also Facebook and Instagram, and oh, how uncomfortable everything is there. Probably, eternity will have to copy everything with pens!
The painstaking way of collecting a report manually has many advantages and disadvantages, but it all covers one huge disadvantage - the time spent writing the report. Analytics and drawing conclusions is not a couple of hours. There is no escape from this, but the mechanical work itself: collecting data from systems, stitching various documents into one, the design of the final version of the document is delayed for a long time.
Fortunately, there is a way out: instruct us to do everything, then our specialists will do this painstaking work with their own hands and implement it into work automatic report generators.
Here the first big problem arises: to use different services to generate reports in separate areas or one that can collect information from all tools? Looking ahead, I'll tell you a secret that our world is not perfect, and there is no such ideal tool. Not yet 😉
Let's start by creating reports for individual channels. The list below is as automated systems, where you only need to select a few parameters, click "ok" and complete the data with the output, and tools that can quickly "extract" any data in a semi-automated way for independent use in presentations, reports, etc.
contextual advertising
- Google Docs + OWOX + Supermetrics plugin.
A free bundle that will help you collect automatic daily data uploads. It will be convenient both for frequent checks and when generating a monthly report. As you understand, you will have to draw graphs and conclusions on your own. ️ Instructions for connecting this bundle are common, it will not be difficult for you to find it on the Web. - Uploading independent reports from Google Adwords and Yandex.Direct.
The systems have a built-in unloading of reports. Data is collected from 5 minutes to 1 hour. Reports do not boast beauty and convenience, but this is a free method. Can be used as an attachment to a handwritten report. - Google data studio.
A simple tool for working with analytics. Works only with Adwords and Analytics. You can collect data upload for the month / for the day / current position and so on. The data is loaded through the Adwords API. It is possible to integrate information from Yandex.Metrica and Yandex.Direct, but difficulties may arise. Instructions for working in this system are also distributed on the Internet. - SEO Reports and ReportKey .
Collect data from Metrika, Direct, Analytics, Adwords. These are the most automated generators. Everything is convenient in the services, you just have to conduct analytics and add a conclusion.
SEO
- upcheck.
Able to make not only a progress report, but also a website usability audit - it will help with the initial check. Finds problem areas quickly. There is a pdf download. - SEOsputnik.
Simple and visual reports, the data of which is downloaded in one sequence. In reports, unfortunately, you cannot add your own comments and conclusions, you cannot swap blocks, that is, you cannot customize the report. There is integration with Topvisor, Allposition, SEOliib and Seobrain services. - SEO Reports and ReportKey .
Two services from the selection above. They can collect data from large SEO services like Topvisor and SE Ranking, there is a good customization of reports.
SMM and targeted advertising
- Jagajam.
It can provide data for any period on all the main parameters of SMM promotion. User participation in the life of the community, likes, reposts, comments, number of posts. The service is more suitable for auditing other people's pages or getting acquainted with the work of your SMM specialist. The service collects data from the following social networks: VKontakte, Facebook, Odnoklassniki, Twitter, YouTube. Billing is based on the number of completed reports, and not per month of subscription. - Popsters.
A tool loved by SMM professionals. Used to analyze the performance of accounts, especially on Instagram. You can evaluate the popularity of posts, compare pages, and even correlate posts by text length. In my memory, this is one of the first services that began to use such a parameter as ER - user engagement. Works with VKontakte, Facebook, Odnoklassniki, Instagram, Pinterest, Twitter, Youtube. Billing is for a month of subscription and 1 social network. - SEO Reports.
Service for generating data to promote your site. Additionally, there are modules for collecting data on Facebook and VKontakte. They will bring the information in a neat form, for any chosen period. All you have to do is analyze and draw conclusions. - ReportKey .
An analogue of the service above, more flexible in terms of interface and adding your own notes to the collected data. The creators promise that they will soon add an integration module with the MyTarget system. - Unloading data by own means of the used social network. IN Facebook And In contact with there is an unloading of data both from the advertising account and from the statistics section. The upload will not be as beautiful as the services above, but this method is free. ️ You will have to deal with the parameters you need and the construction of pivot tables in Excel. But you can make almost any graphs and charts.

Our way
We studied the existing offers on the market, tried to implement them in our own work to speed up the writing of reports. All the services and tools listed above have different properties. Some of them are only in English. We analyzed, tested and selected two "leaders" for the final tests. From the selections above, you can guess that these are SEO Reports and Reportkey.
You can work with these services in different areas, they are Russian-language and have integration with most of the services used in Internet marketing. For convenience and understanding of integrations with report generators, we have compiled a table:
| Integration | SEO Reports | ReportKey |
|---|---|---|
| Yandex.Metrica | + | + |
| Yandex.Direct | + | + |
| Yandex.Webmaster | + | – |
| Google Analytics | + | + |
| Google AdWords | – | + |
| Topvisor | + | + |
| SE Ranking | + | – |
| AllPositions | + | – |
| SeoLib | + | + |
| VKontakte: community statistics | – | + |
| VKontakte: target | + | + |
| MyTarget | + | – |
| Facebook: page statistics | – | – |
| Facebook: target | + | + |
| Bitrix24 | + | – |
| Callibri | – | + |
| mango office | – | + |
| calltouch | – | + |
| Ringostat | – | + |
Minimum task: automate the creation of reports on projects with a mono-service (where work is only on SMM, contextual advertising or SEO optimization).
Maximum task: speed up the creation of reports in large projects (work is going on in several directions at once), where writing and generating a general report can take up to 10-12 hours of working time.
Both services initially satisfied us with a catalog of integrations - a specialist in each area can easily get the necessary, or almost all, necessary data.
contextual advertising
Both selected services comprehensively collected data from both Yandex.Metrica and Google Analytics. You won’t get Adwords data in ReportKey until you install Analytics on the site (and Analytics will collect data only from the moment of installation, remember this).
SEO
SEO Reports has a wider catalog of integrations, so if you want to speed up writing SEO reports, I advise you to use this service. ReportKey has integration only with SeoLib and Topvisor, but it is possible to bypass this nuance when using SE Ranking. Topizor has an export of data from SE Ranking, it is worth setting it up once, and the data will be in it.
SMM and targeted advertising
Let's start with important nuances, which are. SEO Reports does not have the ability to download community statistics from social networks, so you will have to do it yourself, i.e. manually. You can systematize data not in the form of graphs, but fix it in the text part of the report. Data upload on targeted advertising from ReportKey is too detailed - the report turns into a long scroll. This shortcoming is partially solved by creating report templates.
Also, ReportKey lacks integration with Mytarget.
Interface and editing options
Services create reports in a fairly typified way. Before uploading, we recommend that you select the data collection options you need and need. Additionally, in both services, you can write a text comment to the report. There is one caveat: in SEO Reports, you can only write a comment in advance, before uploading the data, which seems inconvenient and illogical to me. ReportKey has this opportunity after data collection. Also, you can add a comment to each sheet and graph.
Unfortunately, you cannot substitute your own block (sheet) between automatic blocks in a report to add a text comment, third-party tables and images.
Both generators have export to doc and pdf. This makes it easier to upload data. In addition, it becomes possible to edit the report no longer in the services system. True, as practice has shown, this did not save time.
As a result of all the tests, we opted for the Reportkey service and completed the minimum task. Now we create reports on mono-projects using the above generator, in particular, on contextual advertising. This speeded up writing reports by 2 times.
But the automation of reports on large projects did not speed up: analytics and conclusions still require a large number time. Simply put, we failed to rebuild automatic reports for a convenient and familiar form of reports on large projects.
Conclusion:
You need to select a service for generating reports based on the needs of the project. Not every program can boast of flexibility. And not all projects require it. The best way choosing a convenient generator - get acquainted with demo versions of reports or take a free trial period. Such opportunities are available on the websites of both generators.
If you have any questions, you can ask us at
This is a true story. It is collected bit by bit - from advertising accounts of clients, audits, correspondence and screenshots. Spoiler: one of the clients referred to in the article spent 6,000,000 rubles on advertising. And their agency didn't even track the targets.
We do not pursue the goal of slandering anyone or scolding competitors. There are no perfect agencies and no perfect clients. Everyone makes mistakes, and so do we. This article is an attempt to once again draw attention to the problems of the market and make it better.
The client's problem is that he does not understand advertising. And, as in a bad car service, the mechanic will not look at the beauty and kind heart of the girl at Infinity. He cheerfully charges her everything at full price, while the latter tries to understand what “condensate in a carburetor” is.
There is no shame in the fact that a business owner does not understand advertising. That's why he hires an agency. But let us, nevertheless, tell you in a very simple and understandable language where and how you can be deceived. And what does it all cost.
Targets not set. Example 1
Our remarks:
Yandex.Metrica is not configured for conversion purposes. No call back, price calculator, chat.
Agency response:
Setting goals, as noted in the previous letter - in the process.
This is where the agency tells the client that goal setting is in progress. And an inexperienced client will not ask unnecessary questions. In fact, goals must be customizedbefore the start campaigns.
What are goals?
Goals are certain events or actions of visitors on the site that configured in analytics systems. With their help, you can see how many important actions were taken by people who clicked on ads.
What are they needed for?
This statistics gives an understanding of the effectiveness of campaigns, the profitability of advertising in general. For example, you can see that for one advertising campaign people go to the site, but then quickly leave. And on the other - go and buy. With the help of this data, advertising campaigns are evaluated and a strategy is built.
What happens to a client's advertising campaign without set goals?
The agency led campaigns in one of the most expensive topics - real estate. With a budget of half a million rubles, people did not even bother to set goals and evaluate the effectiveness of advertising.
That is, the indicators were measured by clicks to the site. At the same time, out of 10 campaigns, only one could bring applications, and the remaining 9 simply waste the client's budget.
Working without goals is a direct drain of money.
What are the agencies behind?
This is one of the most common methods of unscrupulous performers. Often, the goals are not set up specifically, because the statistics on the number of clicks looks more impressive than the report on real requests and calls.
Managers convince the client that "traffic is growing / the cost per click is falling / we are doing well."
In fact, efficiency should not be looked at in the number and cost of clicks. The main indicator here is the number and cost of targeted actions. But it is this indicator that is difficult to keep at the level if you do advertising poorly.
Targets not set. Example 2
Let's look at examples of reports from an agency that advertised for a large Russian sanatorium. Advertising budgets - 500,000 rubles per month. Figures and screenshots are taken from our audit.
Here is an example of a contextual advertising report that a client received.
At the same time, we are talking about budgets of 500,000 rubles per month. That is, a year - 6,000,000 rubles.
And here is the report:
Report without key indicators
What's wrong here?
If it were now 2006, such a report could pass. But in 2017, sending such reports should be a shame.
The report does not contain key indicators - conversions, ROI, the number of requests and calls, the cost of conversions for these indicators.
And one more:

What's wrong with this report?
Here the situation is the same - vague phrases, no goals, specifics and real results from advertising.
An increase in traffic, on its own, means little without other indicators. And these statistics need to be looked at together with the data on the configured goals.

The report does not contain conversion indicators, cost of calls
Another report from which nothing is clear. We learned the average costs, the average number of clicks too.
Wherein:
- There are no conversion rates, cost of calls, analysis of the quality of such calls, analysis of the further funnel of such calls.
- The conclusions are dominated by the most streamlined words and subjective opinion -« on this moment obviously Andobviously doing well." .
No statistics and no socio-demographic indicator configured
Our remarks:
Rate adjustments are not set for mobile and socio-demographic indicators.
Agency response:
This question has already arisen, after discussion with the Yandex manager, an answer was given.

Classic transfer of responsibility to a third party. To enable social dem bid adjustment, you need to check 3 checkboxes in the campaign settings. The problem here is not in the checkboxes, but in incompetence, and in the fact that the agency does not see the need to do this at all. The classic option is when campaigns are launched and forgotten about.
Yandex's support is rather conditional - on the other side sits an ordinary manager who does not have to dive headlong into the essence of campaigns. The task of the agency is to defend the interests of the client. The question here is why the agency even asked the Yandex manager whether to enable this feature.
Agency response:
“In our further work with audiences, social dem will be further analyzed, the least relevant audience will be singled out.”
By the time of the discussion, the agency had been advertising the client for six months. The key point here is that the goal analytics were not set up before the launch of the ad, and even after six months. The agency is talking about further work. But in fact, two weeks may be enough to collect statistics.
This is not about classic statistics (who visits the site), but about customized goals, thanks to which you can see who exactly - buys, leaves requests, performs targeted actions.
So, the client can see that both boys and girls come to the site equally, and only girls buy. In this case, you need to raise your bids to show your ad to that group of people. In the analyzed example, the agency did not track target actions at all.
If the client does not know about this, then such an answer from the manager will pass for the truth.
What's wrong here?
In Yandex and Google, you need to set bid adjustments for your priority audience.
Why does business need it?
To improve the effectiveness of the campaign. For example, if your site doesn't display well on mobile devices, you can stop showing ads on smartphones. Or raise rates for priority audiences.
To make such decisions, you need to regularly collect statistics. And in order for the data to be true, it is necessary to correctly configure the analytics systems. It is then that every important action Online.
Retargeting not enabled
Our remarks:
Remarketing not configured.
Agency response:
Remarketing / retargeting in the process of discussion / addition.

If the client does not know that retargeting does not require a titanic additional effort, then they will believe in it. In fact, the specialists did not set up goals. And without them, it is impossible to set up normal retargeting.
This is the same problem as with the user profile settings.
What is retargeting?
Retargeting or remarketing is a type of advertising that “catches up” with a user who has visited a website. At the same time, the visitor does not have to enter the site through an advertisement. Retargeting works for everyone who was on the site and completed certain actions.
Why is this needed?
Not all visitors make a purchase decision immediately after visiting your site and seeing your product. You remind yourself with ads and users keep coming back. Retargeting can be configured according to different criteria. The main thing is that all the necessary goals are set up on the site and in the analytics in advance.
Vague phrases and general wording in reports
We continue the topic of reports. When the agency has nothing to show and goals are not set, two extremes happen - either a pile of numbers and tables, or dubious screenshots and vague wording that "everything is going well."
Another example of such a report is from an agency that advertised for 500,000 rubles a month.

Everything is great here. Starting from the syllable and ending with the signature. Here is the screenshot in question:

The problem is that this screenshot says nothing about the effectiveness of ads. Most likely, the agency had nothing to say and they decided to copy beautiful picture from Yandex.Metrica. For solidity.
And more examples of vague wording and data that do not say anything about whether the client’s advertising budget was invested correctly and whether advertising pays off.

Some more great reports.
The client can accept this as a weighty argument. But the problem is that without adequate settings, you can’t run ads in principle. However, the agency was not embarrassed.

And again, empty, useless numbers.
Here is the call report. Again, it is not clear how much the calls cost. Are there many or few calls now? How much was it in the past? And what is the dynamics?
"Junk" advertising campaign requests
"Junk" requests - requests that are not related to your business. For example, you sell expensive luxury brand watches. Then, the person who enters the query “copy watch cheap” in the search is clearly not your client. Such requests should be excluded from advertising. And, in order to avoid random impressions for similar queries, the words “cheap” and “copy” must be specified as negative keywords in the company settings.
Example from practice:

Screenshot from the audit. The client's ads are covered up so as not to compromise him.
Agency response:

If a client who does not understand the topic comes with this question, then all the answers will seem adequate. But it's not. Let's figure it out.
« These phrases are not there, i.e. the money wasn't spent anyway."
It's not so much about the money, but the fact itself. Showing on such ads worsens the CTR of the campaign and the quality of the account. The deterioration leads to a general increase in the cost of a click. And he is so high in this topic.
Plus, the very fact of such issuance indicates that negative keywords were not worked out. This indicates the agency's approach to advertising and the fact that there can be many such requests.
“To prevent this from happening During the AC, we look at the requests for which there were transitions and minus non-targeted ones.”
Everything is bad here. To our reasonable remarks that advertisingshownon "garbage" requests, colleagues begin to looktransitions.
You should look not at click-through requests, but at requests that led to impressions. That is, if a person entered the query “buy a house in Rostov” into the search bar, saw an ad and did not click on it, then such an ad will not be included in the list of requests that were clicked on. Statistics on it will be collected, and the quality score will fall.
Therefore, you need to look at all requests and carefully monitor those for which there were impressions.
“Screenshots of ads from sites are not pulled into analytics.”
There is a gross error in this phrase. Ads from Google Adwords are pulled up in Analytics. And to Metrica - from Yandex Direct.
If desired, in these analytics systems, you can see the texts of queries. Judging by the dialogue, the manager is extremely poorly versed in the subject.
What's happening?
Agencies are too lazy to list negative keywords. And "junk" ads are shown to people who will never buy this product.

Bad example elaboration negative keywords and junk ads. A person is looking for a tourist navigator, and he is shown an advertisement for a navigator for a tractor.
What does this mean for the client?
Yandex Direct and Google Adwords use complex algorithms to evaluate the performance and compliance of advertisements with user requests. The two main metrics that affect this score are CTR, the ad click-through rate, and ad relevance to the search query, roughly speaking the "adequacy" of the ad.
If there are many ads in an advertising campaign that are shown frequently but are not clicked very often, the system penalizes the advertising campaign by increasing bids. As a result, the client overpays. And, in the long run, creates bad "karma" for itself in the advertising system. In other words, the lower the quality of the ad and its clickability, the higher the cost per click and the higher the cost of advertising.
UTM tags set incorrectly
Case Study


The agency claims that there is no binding of tags to their content. In fact, of course there is. This has to be proved by the help of Yandex Direct.
If the client does not understand how links should be tagged, they will consider this agency's response as correct. But here's the problem.
The tags that we provide in the example are marked in such a way that it is not clear from them which visitor from which campaign performed an action on the site. That is, the analytics system will show that (for example) 10 goals from Yandex have been achieved. And from what campaign - no.
If the client is not strong in analytics systems, then he will not be able to determine this.
This data is needed in order to understand which campaign brings customers and, based on this, adjust the strategy.
What are UTM tags?
Link UTM Example
What are they needed for?
If UTM tags are set up correctly, you can track the effectiveness of your ad right down to the ad and keyword in any analytics or CRM system - this is very important for correct setting advertising, budget adjustments.
Why is it important?
If the tags are configured incorrectly, you can “lose” some data about the purchases and actions of people who clicked on ads. That is, in the analytics system it will be seen that people come, buy something, but where they came from, from which advertising campaign, by which ad - it will not be possible to find out.
Why do agencies mislabel?
Most often, this is a simple lack of professionalism of the performer, nothing more. If the agency did not notice the problem after six months of work, and did not attach any importance to it, this indicates the general approach of the agency to the client's advertising.
It should be?
For labels to work properly, the utm_source, utm_medium and utm_campaign parameters must be enabled. These parameters indicate the source and type of traffic, the name of the campaign.
Ads not relevant to the query
Case Study

In the example above, the agency convinces the client that it works on the principle of 1 request = 1 ad. This principle implies that for every search query a separate, most relevant ad is written. However, the agency slightly modifies this principle by using instead of the entire request individual words out of him.
If the client does not understand what all this means, then he will be sure that the agency works well and fulfills this condition. In fact, there is an error in this example.
1 request = 1 ad is needed in order to include the request in the title and / or in the ad text in full. In this case, you can write a declaration likeBuy a plot by the lakeand thus get 100% backlight in bold in issue.
This approach requires more time and increases the cost of agency services. Therefore, many people neglect it. And the client is told something similar, from the screenshot above.
What is a request?
A search query is a phrase that a person enters into search string. For example, he searches for: "Order a gluten-free cake." In our case, "Order a gluten-free cake" is the request.
Why does the ad have to include the entire request?
This is not a prerequisite. But agencies that work seriously with advertising try to write ads so that the entire request falls into the ad text.
How more words request is contained in the ad, the more it stands out. And these are the main indicators that affect the quality of the ad. The system encourages such ads by lowering entry rates for prominent positions. The ad rises above competitors, the client receives even more clicks and, accordingly, orders. For the same money. These ads are clicked on more often and bring more conversions.
It should be?
It is necessary that the entire request is present in the title or body of the ad. First of all, in the title. If the keyword is too long, it may not fit in the title. Then, the most important words from the query are entered into the title, and the entire key query is entered into the ad text.

An example of placing the entire keyword in the ad and highlighting it in bold.
Responsibility for the texts shifted to the client
Case Study

Usually, the texts are agreed with the client and written based on his wishes. But an important factor remains that the agency must decide which texts will be better. Because the agency is responsible for the result.
By whom?
Such an example shows the attitude of the agency itself to the client's campaigns and to its own business.
Why is ad text so important?
You have a few seconds to interest the client with your ad. Therefore, the text of the ad must be written exactly according to his request,contain a description of the benefits and deterrent factors (for example, if you are selling expensive houses, the deterrent factor will be the price. Or words that betray the high cost).
Writing the right text is not an easy task. And professionals who are immersed in work with contextual advertising know this.
That is why, at the stage of preparing the texts for ads, a good agency will defend its text options and convince the client of its decision.
Selling free services for money
As icing on the cake, here are two more examples from the practice of our audits.
One agency presented to the client as a USP - free connection A/B testing service using Google Analytics. The point is that this free feature for all.
Another agency sold the development of a replacement module to a client phone numbers for 12,000 rubles. And after, they took money from the client for using this module. Everything is fine. Except that such services already exist, they do not need to be developed. But the client didn't know about it.
With that, we don't want to say goodbye to you. The following article will help you evaluate the quality of your contextual advertising settings yourself.
I have already given an example of a report to a client.
Today I will continue the topic and give here a "continuation" of this report.
And this despite the fact that the franchise itself cost about 1 million rubles at that time. and according to customers, “applications for 90 rubles” that came from Direct turned out to be the highest quality as a result. other traffic sources, although they brought a lot of applications, but in fact did not solvent audience.
This is me again to the question that the final effectiveness is measured not in the number of clicks and not even in the total amount of incoming calls and applications. But in real profit that a businessman can "touch".
Therefore, NEVER evaluate "professionalism" by secondary indicators - CTR, number of clicks, number of ads, cost of the application.
If your site and your sales department are "pumped"–A “correctly” configured Yandex.Direct should eventually give you profit.
It is better to get 10 applications but the most targeted and motivated to buy, rather than 50 "left" or "bottom".
I give the report here "as is" without editing and editing so as not to spoil the overall "impression" of what I read 🙂
Report to the client on search advertising Yandex Direct
Your first wish was to reduce the cost of the application on the site to 200 rubles. for the application.
Let's take a look at the search ad statistics:
This was achieved thanks to the targeted selection of key phrases and texts of advertisements that motivate the user to perform a targeted action - to leave a request on the site.
* Note. In addition to the design of the landing page and the advertising text on the page, the landing page conversion is also influenced by the text of the advertisement.
Yes, the number of applications on the search is not large - only 19 in 3 weeks, but these applications cost less than 100 rubles.
Thus, during the day from Yandex search, we get very high-quality filtered traffic, albeit in small volumes.
As for the night search campaign, everything is much more modest:
Only 40 clicks and 4 conversions, the cost of each conversion is 113 rubles.
The cost of the application is slightly higher than in the daytime, there are few applications. This is explained by the fact that at night the user is less motivated to perform targeted actions.
But the CTR is slightly higher at night, and the rate per click is lower.
This will allow us, at the end of the 28 days of search advertising rollout, to cast the campaigns by time targeting.
Thus, daily orders will cost us even less.
And finally, the most interesting 🙂

Over 4 days off, we received 10 conversions, and each conversion cost less than 80 rubles!
Paradoxically, the cost of a click on weekends, on the contrary, was HIGHER than on weekdays.
This suggests that on weekends, users are the most active and “warmed up” to perform a targeted action, despite the abundance of offers on the market.
Conclusion: in total for 3 weeks, we received 33 conversions from Yandex search with an average order price of 87 rubles. At the same time, users showed the greatest activity on weekends. I advise you to take this feature into account when planning your other advertising campaigns (partnerships, advertising mailings, etc.)
Report on the Yandex Advertising Network (YAN)
After carefully analyzing advertising campaigns on thematic sites, I concluded that, in accordance with your wishes (the price of an application is less than 200 rubles), it is unprofitable for us to turn around on thematic sites with a rate per click of more than 5 rubles.
However, if I immediately lowered the rates, then we would noticeably lose in coverage (the volume of traffic purchased).
Therefore, I decided to change the approach - I created a separate advertising campaign for YAN with an expanded set of key phrases and tough filter ads, the task of which was to cut off the unnecessary target audience.
Let's see what came of it:

In 8 days, we received 682 clicks and 23 requests. The average cost per click was 3.46 rubles. and the average bid price is 102.68 rubles.
Those. The application cost almost 2 times cheaper than you asked.
As for the other two campaigns with more targeted queries, let's look at the statistics for them.
Day Campaign:

This campaign brought 19 applications, the average price of an application is 156 rubles. The average cost per click for targeted queries is 6 rubles.
Exit Campaign:

Brought only 5 applications, the average price of the application is 147 rubles.
I disabled the night campaign with point queries completely, because. it gave very few clicks and almost no conversions.
Conclusion: as you can see from the screenshots above, they don’t play a special role on thematic sites keywords for which we advertise. More important here is the right ad text and the rates that we pay for clicks. It is from these parameters that how much we pay for the client directly depends.
Total result for advertising campaigns in Yandex
3 thousand rubles went to VAT, 17 thousand rubles remained on the account.

Thus, starting from April 7, you spent 10,139 rubles on advertising. (excluding VAT) and received 79 applications.
Each application cost you 128 rubles.

In the future (if you continue), this figure will improve.
A couple of notes about the landing page
In general, your site is very good, users also like it, as evidenced by the minimum bounce rates in Yandex.Metrica for the “desktop” audience (Mac and Windows):

But there are problems with the mobile audience - iOS and Android users have a 2.5 times higher bounce rate:
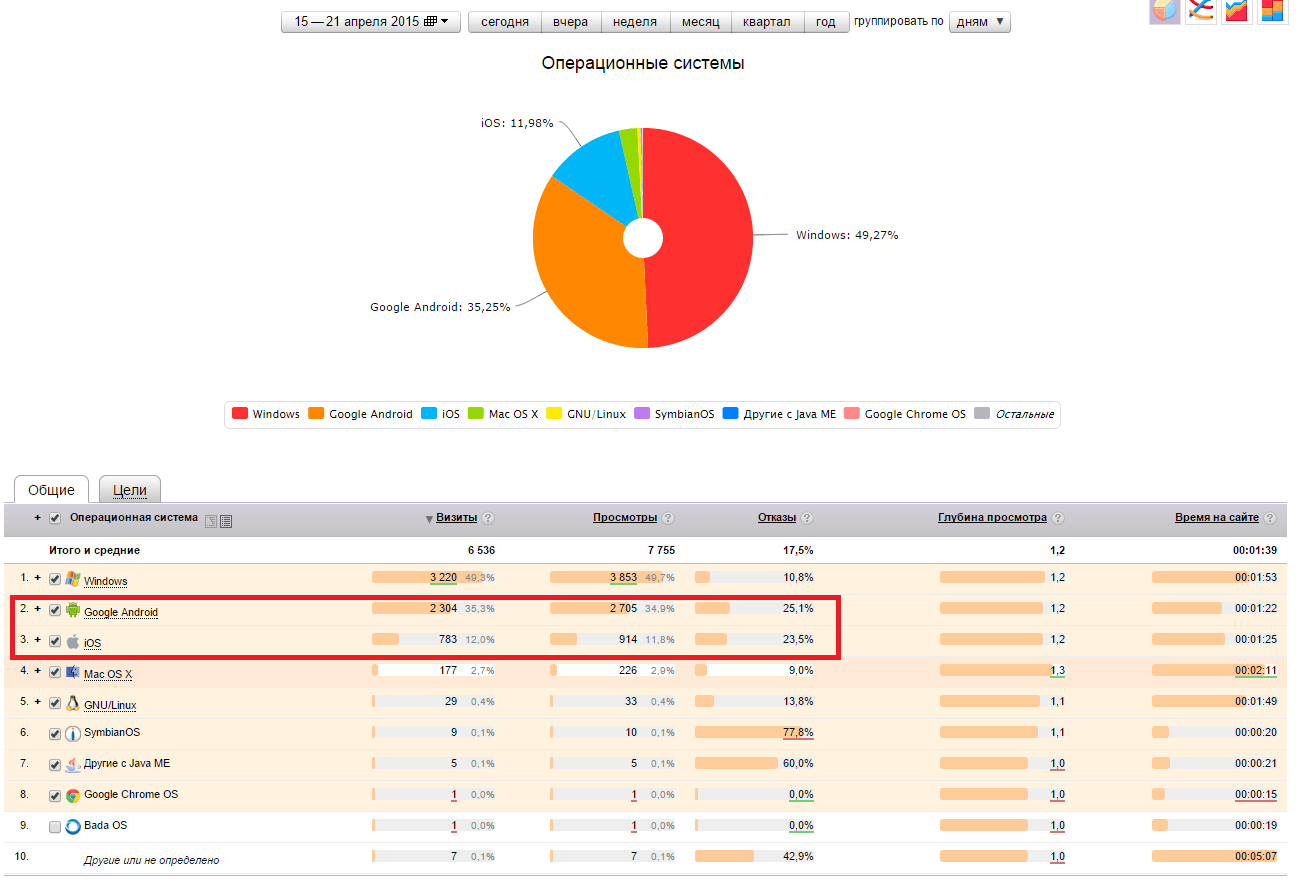
Obviously, the site needs to be optimized for mobile devices.
Also, I note that your site very often "lays down" as soon as the number of visits exceeds 500-700 per day!
To confirm, here are the reports from Direct that came to me by e-mail:
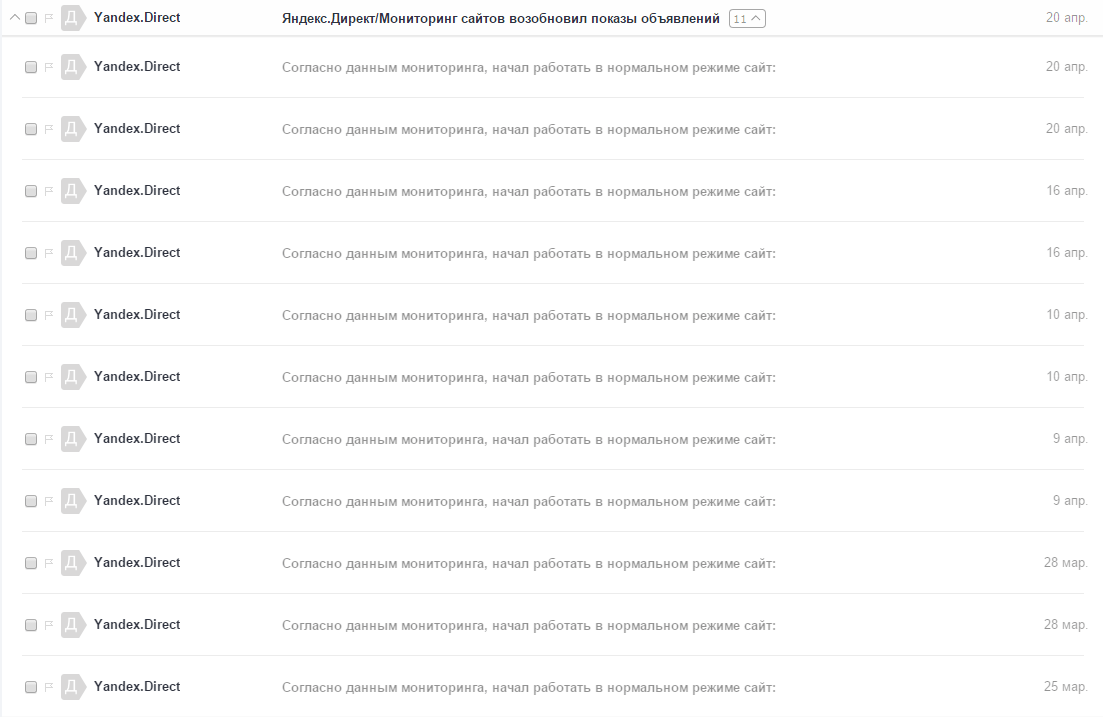
The letter itself:
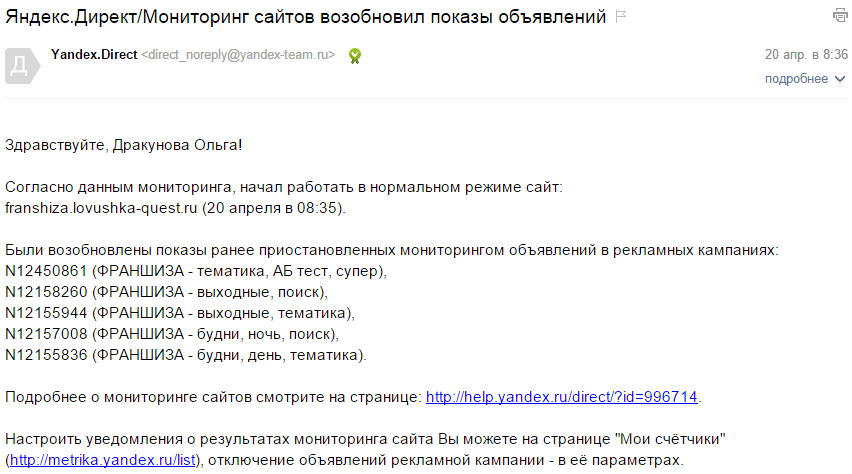
And although Direct (like Adwords) automatically stops advertising after the site goes down, it can take up to 30-40 minutes from the moment of activation to stop.
Think about how many clicks during this time can go "into the void" ...
That's all for now.
If you have any questions, write to me on Skype: direct profit or by mail: [email protected]
Best regards, Dmitry.


