When opening new branches of a company, to calculate the load on the 1C:Enterprise server and other tasks, you may need to look at the dynamics of user work in the information base in the form of a diagram.
The dynamics must be shown for the period selected by the user. The displayed data will be the number of actions taken by these users by hour. Information for such a report can be obtained from the log book.
Let's consider the step-by-step creation of such a report and, using an external data set, build it on a data composition system.
Reading the registration log
And so, we will build the report on the access control system. We will receive data not using a query from the database, but from the registration log. I wrote about the way the platform stores the log in a previous article.
In accordance with the specified period in the report, we need to get all user actions on infobase data. Group the resulting table by user and display it as a diagram (see screenshot above).
To obtain information from the registration log, we will use the global context method "UnloadRegistrationLog()". In the "On Result Layout" event of the created report, add the following program code:
Procedure When Composing Result (DocumentResult, Decryption Data, StandardProcessing) StandardProcessing = False ; // disable standard report output - we will output it programmatically // Get the report settings, incl. period Settings = SettingsComposer. GetSettings() ; // Get report settings ParameterPeriod = LinkerSettings. GetSettings() . Data Parameters. Elements. Find("Period"). Meaning; ZhurTab = New ValueTable; LogSelection = New Structure; // Create a log selection structure // Fill in the selection by period Journal Selection. Insert("StartDate", ParameterPeriod.StartDate) ; Journal Selection. Insert("EndDate", ParameterPeriod.EndDate) ; // Set selection for events EventArray = New Array; EventArray. Add(" _$Data$_ . Delete. New" ); Event Array. Add(" _$Data$_ . Post" ); Event Array. Add(" _$Data$_ . TotalsPeriodUpdate" ); Event Array. Add(" _$Data$_ . Unpost" ); Event Array. Add(" _$Data$_ . Update" ); Log Selection. Insert(" Event ", EventArray) ; // Upload the log UnloadRegistrationLog(JourTab, EventArray) ; // Create and fill in the data for output to the report ZhurTab. Columns. Add(" Time "); ZhurTab. Columns. Add(" Number of Events" ) ; For Each Page From Journal Cycle Page Time = Hour (Page Date) ; Page Number of Events = 1 ; End of Cycle ; // Group the result ZhurTab. Collapse(" Username, Time" , " Number of Events" ) ; // ..............The first parameter of the "UploadRegistrationLog" method sets a table of values into which the result of the selection from the registration log will be uploaded. The second parameter is to set a filter on the selected records. A filter is a structure, the keys of which are the fields by which selection is established. We use the "Start Date" and "End Date" fields to set the log analysis period, as well as the "Event" field, into which we pass an array of strings (names of events). The events added to the array correspond to actions on the data in the database.
You can read more about using the "UploadRegistrationLog" method in the syntax assistant.
We transfer the table of values to the access control system
In order for the ACS to be able to work with the resulting table of values, you need to do the following:
1) Create a data set in the layout diagram and set its fields. 2) In the program code of the "When Composing the Result" module, register the transfer of the table of values to the access control system.
3) Set up the resources and structure of the report (for more details, see the report file, the link to which is given at the end of the article).
At this point, the report settings are completed and we can run it in enterprise mode.
Bottom line
An external data source in the ACS allows us to use data from almost any sources in reports, including those whose data we cannot obtain through queries.
Using ACS for such sources allows you to create reports with a flexible system of settings, and also allows the user to change the report output and its structure. All capabilities of the data composition system will be fully used for such sources.
You can download the report from the example at the following link.
In my last article, I already wrote that 1C is a paradoxical platform. The data composition system is one of these paradoxes. SKD is designed for designing complex reports and involves replacing “manual” report programming with design in a multifunctional toolkit. The ability to use access control systems appeared in the eighth version, but it took a long time for version 8.2 to appear so that 1C could use it in its standard products. On the one hand, ACS is a multifunctional toolkit, using which you can create very complex reports without a single line of code. However, the access control system has a fairly high barrier to entry; learning and starting to fully use it “on the fly” is very difficult, because the interface is not entirely intuitive, and the most complete manuals for use are available only in the form of paid literature.
In the process of my study of SKD, a problem arose. It is necessary to obtain data from a third-party table of values using a query language and then operate this data as with similar data from database tables (reduction operations, grouping, and so on). In the classic format, we would create a query that receives information from the table passed to the query as a parameter.
Request = New Request(
"CHOOSE
| Table.Nomenclature,
| Table.Warehouse
|FROM
| &TK AS Table");
Request.SetParameter("TZ", TZ);
But with SKD everything is not so simple. Alas, it is impossible to perform the operation described above in the data composition system. However, the system has implemented the ability to load external tables of values.
Here it’s worth making a short digression and talking about Datasets. Data sets are sources of information from which the data management system receives data that it later compiles into a report. Data sets are divided into types, mainly using the “Query” type, in the body of which the programmer writes a query to the database. The "Object" type is used to load data from external objects. In both cases, the output is a certain set of fields obtained as a result of executing a request or loading an external object. Later, these fields can be manipulated on the “Settings” tab, along with detailed settings for the report structure. To interconnect different sets, the ACS provides the ability to indicate connections between data sets in the tab of the same name. These connections are a direct analogue of the left join in a classic query. However, it should be taken into account that queries in any data set do not “know” about the existence of other data sets; ultimately, the relationships between the data sets will affect the layout of the data according to the structure specified in the “Settings” tab.
Let's detail the problem down to an example. There is a standard report: Payroll statements for the organization of configuration ZiK 8. It is necessary that the types of calculations in the report be grouped into certain groups. Calculation View-Group correspondences are stored in an external value table. To load it into the main data layout scheme, we create a “data set object” with the name “Groups” (Figure 2). We make a connection with the “query data set” - “Accruals” by type of calculation (Figure 3). In the “request data set” - “Accruals” there is information for groups, we delete all entries. Afterwards, on the “Settings” tab we can use the “Group” field, the value of which is loaded from an external data source (Figure 4). In the report generation function, we supplement the loading of external data.
Function GenerateReport(Result = Undefined, Decryption Data = Undefined, OutputInReportForm = True) Export
//obtaining or forming the required table of “Groups” values and writing it to the variable of the same name
ExternalData = New Structure();//create and fill the external data structure
ExternalData.Insert(Groups);
UserPanelValue = TypicalReports.GetUserPanelSettingsValuesofObject(ThisObject);
DefaultSettings = SettingsComposer.GetSettings();
TypicalReports.GetAppliedSetting(ThisObject);
TypicalReports.GenerateTypicalReport(ThisObject, Result, Decryption Data, OutputToReportForm, ExternalData);
SettingsLinker.LoadSettings(DefaultSetting);
Return Result;
EndFunction
If we were making a report from scratch, the report generation launch code would look like this:
ExternalDataSets = new Structure;
ExternalDataSets.Insert("Groups", Groups); //Groups - the desired table of values
DataCompositionSchema = GetLayout("MainDataCompositionSchema"); //our layout with data flow diagram
Settings = DataCompositionScheme.DefaultSettings;
LayoutLinker = newDataLayoutLayoutLinker;
LayoutLayout = LayoutComposer.Execute(DataLayoutSchema, Settings);
DataCompositionProcessor = newDataCompositionProcessor;
DataCompositionProcessor.Initialize(LayoutLayout, ExternalDataSets);
TabDoc = New TabularDocument;
OutputProcessor = New OutputProcessorDataCompositionResultInTabularDocument;
OutputProcessor.SetDocument(TabDoc);
OutputProcessor.Output(DataCompositionProcessor);
Read 9660 once
Hello!
Today I want to describe a topic that you can’t understand without scuba gear :) ;)
Scuba diving means the dive is quite deep. There are few references to this topic in the literature, and you won’t understand it until you get the urge. There won’t even be a message for such an action ;) By the way, the documentation talks about this very poorly and inconsistently; you have to turn to third-party literature.
For example, I highly recommend “Development of complex reports in 1C:Enterprise 8.2.” Data Composition System", (more specifically, see pages 224, 267 and 473)
In ACS there are 2 types of data sources: Query, object and union (this thing does not count, it is not a source of data, but a processor of existing data). See Figure 1:
So, if we more or less understand how to work with a source (set) of data of the “Query” type, then there are difficulties with the “Object” data set.
First, I’ll describe what we want to get as an output:
Report, the user clicked the " Form» and a list of items was displayed (see Fig. 2):

Yes, I made one inaccuracy, namely: there is no button “ Form", but there is a button " new action"(I’ll explain a little later why this happened;)
Yes Yes! Another point: this entire list is derived from the “Object” data set:

Solution:
- Create an external report;
- Add an ACS layout, let's call it “Main Data Layout Scheme”;
- We add the “Object” data set to it, assign it the name “Nomenclature List” (should be the same as in Fig. 3);
- We don’t experiment too much with the report settings, let everything be simple (see Fig. 4)

Ok, half the job done ;)
Now let's generate the main report form (yes, one more thing! My configuration works on a regular interface, but I think you will find a solution on managed forms;) So, the form:

This is where the problem arises! If we click on the “generate” button (Fig. 5.), we will see an error!

I dedicated this article to solving this problem!
It was not possible to intercept the “Generate” button event, so I decided to use a crutch. I launched the configuration in debug mode and tried to find the “generate” button.

I inserted the “Generate” procedure into the form, but there are no entries into it, I had to redefine the action of the “form” button before opening the form:

In Fig. In addition to changing the action of the form, Figure 8 shows an example of a request, its processing and transmission of the generated data to the access control system. Let's study it more carefully:
- We generate input data for the access control system;
- We initialize the access control system;
- We display the result ON THE FORM (pay attention to this as well!).
Let us recall the interaction diagram of data composition system objects:

The data layout schema in an external report is available as a global object in a form method DataComposition Schema. You can also access it by name by passing it to the method GetLayout(see Fig. 8)
The main piece of code is below:
Request = New Request; Query.Text = "SELECT | Nomenclature.Name as Nomenclature |FROM | Directory.Nomenclature AS Nomenclature"; NomenclatureList = Request.Run().Upload(); DataSets = New Structure("NomenclatureList", NomenclatureList); //SKD = GetLayout("MainData LayoutScheme"); SKD = DataCompositionScheme; LayoutComp = new DataLayoutComposer; layoutComp = LayoutComp.Execute(SKD, SKD.DefaultSettings); CompDataProcessor = new DataCompositionProcessor; ProcessorCompData.Initialize(layoutComp, DataSets); output = new DataCompositionResultOutputProcessorInTabularDocument; output.SetDocument(FormElements.Result); output.Output(ProcessorCompData, true);
Yes! Here's another nice moment!!!
In this example, as you can see (see Fig. 2), the output is carried out in a form, and not in a table. document! And this is very good, because we can work with the form (programmatically intercept the events of the form element, do all sorts of tricks with drag and drop, etc.;)
In a spreadsheet document, we can simply display the processed data on the screen and transfer control of the document to the user and we cannot in any way influence the further process of editing this content!
See the help system " Spreadsheet document field “, and I’ll just give an excerpt from the built-in documentation of the 1c Enterprise 8.2 system:
“A spreadsheet document field is a spreadsheet document placed on a form. Along with the variety of design capabilities of a spreadsheet document, this allows you to organize the processing of events that occur when selecting cells, pictures, as well as other controls placed in a field of a spreadsheet document.”
Okay, as they say, good luck in the battle;)
41
I recently made a report with an indefinite number of columns. I didn’t want to tinker with the code, so I decided to do it on the access control system. There was no problem with this, it was necessary to stretch the result onto an arbitrary layout (your own header +...
27
Even though CDS students come across this on the first or second day, it should be in the FAQ section. A simple example of programmatically outputting a report on a layout, using the default settings. //Get the diagram from...
18
When generating reports on the access control system, by default all groupings are expanded, but sometimes it is necessary to show a report with collapsed groupings immediately after generation! This code in the report module allows you to collapse...
10
On this tab you can specify what connections are made between two or more data sets, according to what parameters and conditions..png 1. “Source of connection” - indicates the first set of data, from...
9
What is required when developing reports is that for a user with limited rights, the report is generated completely without checking rights! Especially if RLS is configured. There are several ways to do this: 1. Install...
So, how do you create an ACS report using data from a value table? First things first.
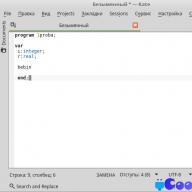
First of all, open the configurator and create a new external report.
Open the object module and create a predefined procedure When Composing Result (DocumentResult, Decryption Data, StandardProcessing)

Inside this procedure we will collect data and generate a report.
In the When Composing Result procedure, we disable standard processing. StandardProcessing = False;
Then we form a table of values in an arbitrary way. The names of the columns of the value table must match the future fields of the data set in the ACS:

For example, let's add three rows of data. Next, we create the report output step by step.
- From the diagram we get the default settings.
- We send decryption data to the appropriate variable.
- We create the layout using the layout builder.
- We transfer the diagram, settings and decoding data to the layout layout.
- We perform the layout using the layout processor. To do this, execute the data composition processor's Initialize() method. As parameters we pass the data composition layout, external data sets (type: Structure, the structure key must match the name of the object in the data composition scheme, the value is the generated table of values), decryption data.
- Clear the field of the spreadsheet document.
- We display the result in a spreadsheet document.
DataLayoutSchema = GetLayout( "MainDataCompositionSchema"); //Settings = DataCompositionScheme.DefaultSettings; // - If you do it as shown above (recommended on some resources), then when you change the settings in client mode // you will not see these changes, because the settings will always be by default. How to do it correctly - option below Settings = SettingsComposer. GetSettings(); DecryptionData = newDataCompositionDecryptionData; LayoutLinker = newDataLayoutLayoutLinker; LayoutLayout = LayoutLocker. Execute(DataCompositionScheme, Settings, DecryptionData); ExternalDataSet = New Structure( "Value Table Example", TZOutput); DataCompositionProcessor = newDataCompositionProcessor; DataCompositionProcessor. Initialize(LayoutLayout, ExternalDataSet, DecryptionData); DocumentResult. Clear(); OutputProcessor = New OutputProcessorDataCompositionResultInTabularDocument; Output Processor. SetDocument(DocumentResult); Output Processor. Output(DataCompositionProcessor); Adding a layout diagram layout. We can leave the name as default.

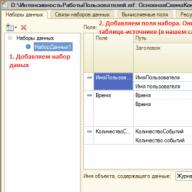
We create a data set. To do this, add a new data set of the Object type. In the Name field of the object containing the data we place the name that we specified as the key when creating the External DataSet structure. Then we add fields. The names must exactly match the names of the columns in the value table. Next, we can specify acceptable values, formats, etc.

Add resources if necessary. The results will be calculated based on them. In our case, these are the Quantity and Amount fields.

In the Settings tab, using the settings designer, we create a default report option

We save our report. We launch it in the client and create it. An example of running an ACS report using data from the table of values is shown in the picture.

That's all. Simple enough, right?
The resulting example report can be downloaded