As practice shows, users are only satisfied with the capabilities of their own computer for the time being - sooner or later they have to resort to an upgrade. Everything is banally simple - new versions of the OS and applications used, as a rule, require more and more resources. The easiest way to update your PC is to purchase a new system unit with modern hardware, which is not difficult if you have the money. However, this is not always reasonable - often to increase productivity it is enough to resort to replacing individual components.
To choose an upgrade strategy, you need to find out what hardware is installed and understand what the computer lacks for faster operation - processor power, video system capabilities, memory capacity, hard drive read/write speed, etc. But this is only one side of the coin. After purchasing a new system unit or upgrading an old one, you will need to quickly find out whether the “filling” of the system unit corresponds to what was stated at the time of purchase (without opening the unit itself, since there may be a seal on it), evaluate how much the performance has increased, and understand whether the computer is really stable works.
Any professional assembler (and all overclocking enthusiasts) can easily solve the listed problems, since they have in their arsenal many diverse and highly specialized information and diagnostic tools. The average user has no need to acquire such solutions, but it is still necessary to install a simple comprehensive utility for obtaining information about the hardware and testing the computer. These are the programs we will consider in this article.
Retrieving Hardware Data
Theoretically, any information diagnostic utility is capable of recognizing the “stuffing” of a system unit. However, not every program is able to identify new models of processors, video cards and other hardware (it all depends on the completeness of the database and the regularity of its updates), and the amount of information on the identified components can vary - from minimal to exhaustive.
Among the solutions considered, the program has the most detailed information AIDA64, which knows almost everything about any hardware, including the latest innovations. For example, this utility will be able to recognize Intel 510 and 320 SSDs that have recently appeared on the market, AMD Radeon HD 6790 and NVIDIA GeForce GT 520M video cards, five new Quadro M series mobile video cards from NVIDIA, etc.
Using AIDA64, you can easily find out everything about the processor, motherboard, video card, network adapter, drives (including the latest SSDs) and input devices, multimedia, as well as ports, external connected devices and power management. The program is able to determine the type of flash memory, controller model (reading SMART information of controllers manufactured by Indilinx, Intel, JMicron, Samsung and SandForce is supported) and data transfer speed. Moreover, the utility recognizes USB 3.0 controllers and devices compatible with this new standard.
The volume of data provided by AIDA64 is impressive - access to it is provided from a tree-like menu of sections that combine the main modules of the program. Yes, through the section Computer it is easy to obtain aggregate information about hardware components, the system and BIOS, as well as data on processor overclocking, power supply features, the state of system hardware monitoring sensors, etc. (Fig. 1).
Rice. 1. Summary information about the computer (AIDA64)
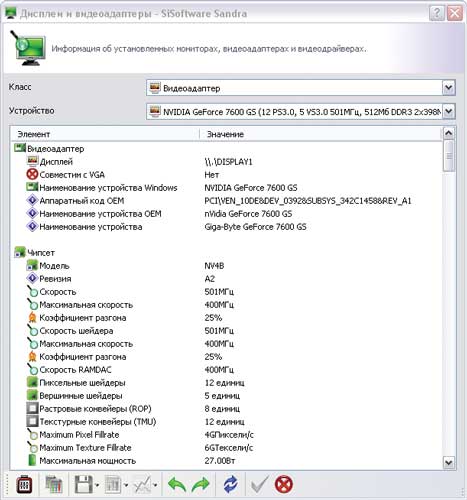
Other “hardware” sections provide more detailed information - so in the section Motherboard there is detailed information about the central processor, motherboard, memory, BIOS, etc. In the section Display it is easy to obtain information related to the graphical interface of the system (in particular, information about the video adapter and monitor - Fig. 2), and in the section Multimedia learn about the multimedia capabilities of the system (multimedia devices and installed audio and video codecs).

Rice. 2. Video card information (AIDA64)
In chapter Data storage provides information about hard drives and optical drives, as well as the logical and physical structure of hard drives, the values and statuses of SMART parameters. You can find information about network adapters in the section Net, and about buses, ports, keyboard, mouse, etc. - in the section Devices. In addition, from the menu Service panel opens AIDA64 CPUID(Fig. 3), which displays data about the processor, motherboard, memory and chipset in a compact form.

Rice. 3. AIDA64 CPUID panel
Program SiSoftware Sandra It is also very informative and allows you to obtain comprehensive information about almost all hardware components of a computer system. In particular, the utility displays summary data about the computer as a whole (Fig. 4) - that is, basic information about the processor, motherboard, chipset, memory modules, video system, etc. (tab Devices, pictogram System information).

Rice. 4. Summary information about the computer (SiSoftware Sandra)
Along with summary information, in the tab Devices The utility also provides more detailed information about the motherboard and processor, display and video adapter (Fig. 5), memory, buses and devices installed in them, disks, ports, mice, keyboard, sound card, etc. As for the readings of various types of monitoring sensors, then to receive them you will need to launch not the information module, but the diagnostic module Environment Monitor(tab Tools). This module provides display of text and graphic information about processor temperature, fan speed, voltage, etc.
Rice. 5. Video system information (SiSoftware Sandra)
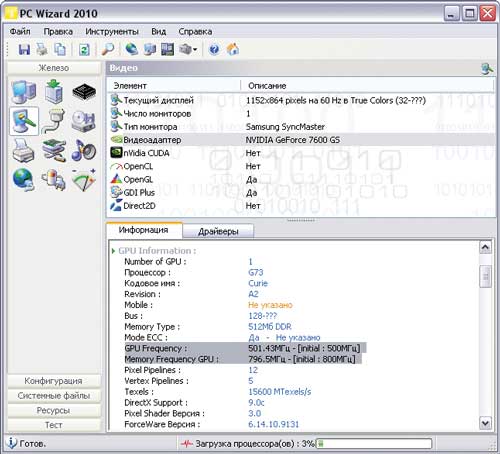
Utility PC Wizard provides access to information about the main hardware modules installed in the computer: motherboard, processor, video card, memory, I/O ports, drives, printers, multimedia devices, printers, etc. All this data is available on the tab Iron. By activating the icon on it General information about the system, you can determine in one click what exactly is in the system unit (Fig. 6) - which motherboard, which processor, etc. Other tab icons Iron will help you obtain more detailed information about components (Fig. 7); The amount of data provided is quite sufficient for the average user. In addition, through the menu Tools → Overclocking information you can find out whether any of the system components (processor, bus or memory) have been overclocked, and if so, to what limits, and also take readings from some sensors.
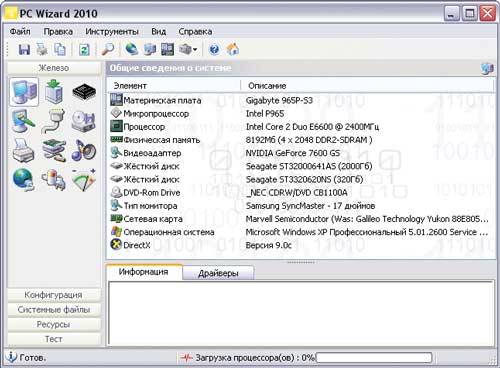
Rice. 6. General information about the computer (PC Wizard)
Rice. 7. Graphics subsystem data (PC Wizard)
Utility HWiNFO32 It will also allow you to learn a lot of interesting things about the hardware of your computer. Immediately after startup, it begins diagnostic tests and within seconds displays a window System Summary with compact display of data about the processor, motherboard, memory, chipset, disks, etc. (Fig. 8). This window can be called up on the screen while working with the utility by clicking on the button Summary. In addition, HWiNFO32 displays detailed information about the processor, motherboard (Fig. 9), memory, video adapter, etc. in the corresponding tabs - Central Processors, Motherboard, Memory, Video Adapter etc. Data on the processor, memory modules, motherboard, buses and disks is quite detailed, information on other devices is more modest. If necessary, it is easy to obtain readings from the touch sensors installed on the motherboard (temperature, voltage, etc.) by clicking on the button Sensors.
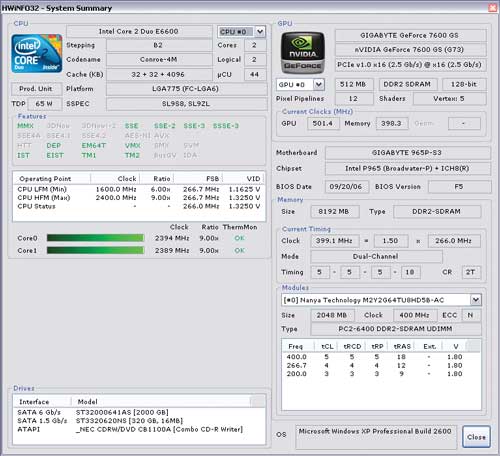
Rice. 8. Summary information about the computer (HWiNFO32)
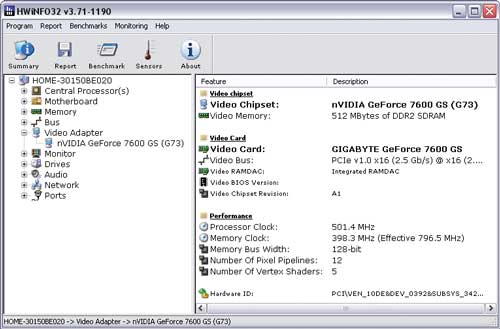
Rice. 9. Video card information (HWiNFO32)
Program Fresh Diagnosis allows you to find out information about any iron components, although not always detailed. For example, on the tab Hardware System you can find out about the motherboard, processor, cache memory, buses, BIOS, CMOS memory, etc. Section Device contains information about the video card (Fig. 10), peripheral devices (keyboard, printer, monitor, optical drives, etc.) and ports. In chapter Multimedia combines data on various multimedia devices, DirectX, audio and video codecs.

Rice. 10. Video card data (Fresh Diagnosis)
Performance Evaluation
Before upgrading, you need to evaluate the performance of the computer and its individual components in order to understand which hardware needs to be replaced immediately, and which components can wait until better times (after all, in a crisis, not everyone decides to completely upgrade). This is quite simple to do by conducting a couple of specific benchmark tests in the environment of a suitable diagnostic utility. After purchasing a new computer or upgrading an old one, it also doesn't hurt to test it to make sure that the computer has become more productive. Of course, you can feel the effect of the upgrade during normal work in applications, but to complete the picture, it is better to verify the performance improvement using tools specifically designed for this purpose.
When conducting tests, to obtain a more objective assessment, it is better to close all applications, not use the mouse and keyboard, run the same test (in the same version of the utility) several times and focus on the average result. In addition, it is worth keeping in mind that the same synthetic tests in different utilities are implemented in a far from identical way, so the programs show different results. And you shouldn’t take the results obtained literally, since they do not reflect real performance, but only indicate the level of performance when performing strictly specific tasks. Nevertheless, conducting such testing makes it possible to understand how outdated the hardware components installed in your computer are in comparison with reference samples, as well as to evaluate the level of performance before and after the upgrade, which is what interests us in this article.
The programs of greatest interest from a testing point of view are AIDA64 and SiSoftware Sandra, some of whose benchmarks are used even by professionals in various hardware testing techniques. The capabilities of the other utilities discussed in the article are limited in this regard, although they also provide some test functionality.
In a programme AIDA64 a wide range of benchmark tests is presented. Yes, in the section Test 13 synthetic tests are combined, the first four of which evaluate memory performance - read/write/copy speed (Fig. 11), and also measure latency (testing the average time the processor reads data from RAM). The rest of the tests in this section evaluate processor performance in integer and floating point operations, when creating ZIP archives, when performing encryption using the AES crypto algorithm, etc. (tests CPU Queen, CPU PhotoWorxx, CPU ZLib, CPU AES, CPU Hash, FPU VP8, FPU Julia, FPU Mandel, FPU SinJulia). All tests compare performance with other systems, including the latest ones.

Rice. 11. CPU performance evaluation (CPU Queen test; AIDA64)
Via the menu Service Three more benchmark tests are available: Disk test, Cache and memory test And Monitor diagnostics. The disk test measures the performance of hard drives, solid state drives, optical drives, and more. The cache and memory test measures the bandwidth and latency of the processor cache and memory (Figure 12). In the test Monitor diagnostics The display quality of LCD and CRT monitors is checked.

Rice. 12. Cache & Memory Benchmark; AIDA64
In terms of testing for a wide range of users, the program is even more interesting SiSoftware Sandra, with which you can not only evaluate the performance of your PC in comparison with other reference computer configurations, but also test your computer to see if it needs an upgrade. Modules designed for testing the most important computer subsystems are combined on the tab Benchmarks. A whole group of synthetic tests is designed to test the processor - arithmetic and multimedia tests, multi-core efficiency tests, power efficiency tests, cryptographic performance and GPGPU cryptography. Several tests are responsible for testing physical drives - including a file system test, as well as modules for testing physical disks, removable/flash drives, CD-ROM/DVD and Blu-ray optical drives. Tests available to test memory include Memory Bandwidth Test, Memory Latency Test, and Cache and Memory Test. In addition, there are tests to evaluate visualization speed and video memory performance, an audio/video encoding/decoding test, a network bandwidth test, an Internet connection speed test, etc. When testing a number of components (processor, RAM, etc.), results are given in comparison with reference models that are more or less similar in characteristics. At the same time, it is possible to independently select standards for comparison, including the most modern ones (Fig. 13), which is very convenient and allows you to quickly understand how outdated the hardware components installed in the computer are and which models are best to replace them with.
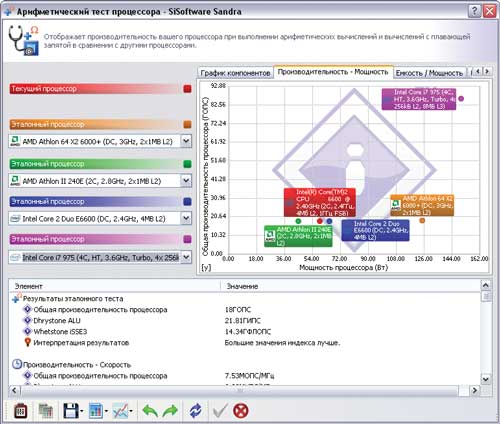
Rice. 13. CPU performance evaluation
(arithmetic test; SiSoftware Sandra)
Two interesting test modules are presented on the tab Tools- these are modules Performance index And Analysis and recommendations. Using the test Performance index The overall performance of the computer is assessed during arithmetic and multimedia tests of the processor, determination of memory bandwidth, as well as testing of physical disks and a video card (Fig. 14). Reference models of components for comparison are selected by the program or the user. Module Analysis and recommendations provides a detailed analysis of the PC for possible upgrades. At the end of this analysis, the program produces a list of recommendations on which hardware components are best replaced in order to improve performance (Fig. 15), and draws attention to possible problems (for example, the difficulty of adding memory due to all slots being occupied, too high processor temperature (and suggests checking cooling), etc.).

Rice. 14. Assessing overall computer performance (SiSoftware Sandra)
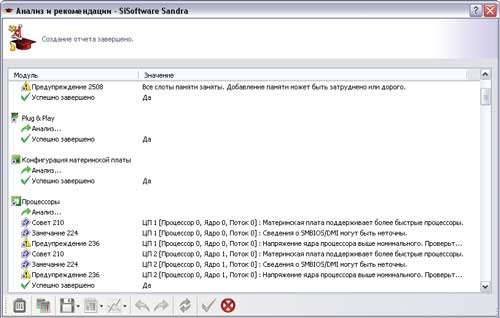
Rice. 15. Computer analysis for upgrade (SiSoftware Sandra)
Utility PC Wizard also includes certain functionality for testing hardware (tab Test). With its help, you can clearly evaluate the overall performance of your computer (icon Global Performance) in comparison with other configurations and based on the test results, understand which of the subsystems in terms of performance significantly fall short of the selected (from a preset list) reference sample - that is, they need to be updated, and which are quite on par (Fig. 16).

Rice. 16. Assessing overall computer performance (PC Wizard)
PC Wizard also has a number of synthetic tests that allow you to evaluate the performance of the processor, L1/L2/L3 caches and memory in general (bandwidth, timing assessment), as well as the video subsystem, hard drive, optical drive, etc. In particular, for The processor is equipped with basic tests Dhrystone ALU, Whetstone FPU and Whetstone SSE2, which allow assessing its performance in integer and floating point operations. Test results are displayed in text and graphical form; in a number of tests, it is possible to compare the results obtained with the test results of the selected reference subsystem (Fig. 17).

Rice. 17. CPU testing (PC Wizard)
Utility HWiNFO32 is able to evaluate the performance of the processor (CPU, FPU, MMX), memory and hard drive during express testing (button Benchmark). Test results are presented in two versions - in numerical form and in the form of a comparative chart. The diagram contains many reference components, including modern ones, so it is easy to understand how the processor (or other component) installed in the computer is inferior in performance to modern models (Fig. 18).
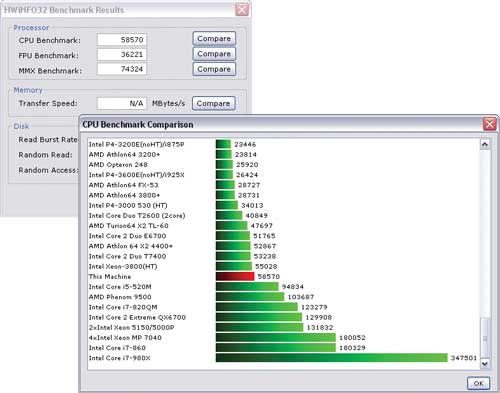
Rice. 18. CPU performance evaluation (HWiNFO32)
Program Fresh Diagnosis has tools for determining the performance of individual system components. These are seven synthetic test modules in the section Benchmarks. With their help, you can evaluate the performance of the processor (Whetstone, Dhrystone and multimedia tests), memory, video system, hard drives, optical drives and network adapter. Test results are presented in comparison with basic systems and presented in the form of visual histograms. True, in our opinion, there is not much benefit from them, since outdated reference systems are selected for comparison (Fig. 19).

Rice. 19. CPU testing (Fresh Diagnosis)
Checking your computer for stability
Unfortunately, it is not a fact that the updated computer will be stable in operation. Why? There are many reasons - for example, the power supply may not cope well with the increased load due to the replacement of the processor or video adapter with newer models.
If such a picture occurs, then the situation should be dealt with as soon as possible - that is, before obvious signs of instability appear in the form of a blue screen of “death”, etc. This means that you need to find out the temperature of the processor, motherboard and other important hardware and understand whether any component is overheating under load, and also evaluate how the computer generally behaves under stressful conditions. This can be done by conducting stress testing.
Most stability tests place intense computational load on various units of the central processor, system memory, graphics processor and system logic set - that is, they force the computer to work under stressful conditions. Unfortunately, none of these tests by itself guarantees 100% system stability, but if the test reveals a failure in the system or was not completed, then this is a clear signal that you need to pay attention to the hardware.
Provided in AIDA64 system stability test (available through the menu Service) is intended for stress testing of the processor (testing cores separately is allowed), memory, local disks, etc. (Fig. 20). The test results are displayed on two graphs: the upper one shows the temperature of the selected components, the lower one shows the processor load level (CPU Usage) and the CPU Throttling mode. Mode CPU Throttling is activated only if the processor overheats, and it should be understood that activating this mode during testing is an alarm signal calling for attention to the operation of the cooling system. During testing, system heating is controlled by continuously monitoring the temperature.

Rice. 20. CPU stress testing (AIDA64)
In addition to temperature, the graphs of which are displayed on the first tab during stress testing, on other tabs the program presents other useful information - about fan speed, voltage, etc. It should be borne in mind that the system stability test in AIDA64 can last indefinitely, so it is stopped manually, making sure that everything is working normally (after 30 minutes), or when suspicious results are detected (for example, severe overheating of one of the components).
Using stability test SiSoftware Sandra(tab Tools), stress testing can also be performed (Fig. 21). It will allow you to navigate the stability of the system and identify its weak points by analyzing the operation of the processor, memory, physical disks and optical drives, energy efficiency, etc. Testing lasts for a specified period of time or without taking it into account - in this case, the number of times the run is indicated selected test modules. During testing, the utility monitors the system state and stops the process if errors occur or in case of overheating (critical temperatures are set by default or manually).

Rice. 21. Stability test (SiSoftware Sandra)
Utility features PC Wizard in terms of testing the system for stability (test System Test Stability from the menu Tools) are limited to CPU and motherboard testing. During testing, the processor is maximally loaded and operates under such conditions for a long time, during which the temperatures of the processor and motherboard are measured at certain intervals, and the results are displayed on a graph (Fig. 22).

Rice. 22. Testing the processor for stability (PC Wizard)
Brief overview of utilities
AIDA64 (Extreme Edition) 1.60
Developer: FinalWire Ltd
Distribution size: 11.7 MB
Price:$39.95
The AIDA64 program is an updated version of the well-known information diagnostic solution EVEREST, designed for diagnosing hardware and software computer resources and versatile computer testing. The utility can be launched from a hard drive, CD/DVD/BD disks, as well as from flash drives. The program is presented in two editions: AIDA64 Extreme Edition and AIDA64 Business Edition; the AIDA64 Extreme Edition is designed for home users. The utility is regularly updated and supports the vast majority of modern models.
SiSoftware Sandra 2011 (Lite)
Developer: SiSoftware
Distribution size: 53.3 MB
Price: free (for personal and educational use)
SiSoftware Sandra Lite is the best of the free information diagnostic programs. It provides detailed information about the computer and any of its hardware and software components, and also allows you to test the PC for performance, the need for an upgrade, etc. The utility can be used to analyze, diagnose and test a PDA or smartphone. The program is available in several editions; for home use, the free edition of SiSoftware Sandra Lite is sufficient. The utility is updated quite regularly and supports the vast majority of modern models.
PC Wizard 2010.1.961
Developer: CPUID
Distribution size: 5.02 MB
Price: for free
PC Wizard is an information diagnostic utility used to diagnose hardware and software components and conduct various testing. In the basic version, the program is launched from a hard drive; it can be loaded from portable devices, for example from a flash drive (a special version of Portable PC Wizard). The utility is not updated as often as we would like (the last update was from August 2010), although it supports many modern models (of course, we are not talking about new products).
HWiNFO32 3.71
Developer: Martin Malik
Distribution size: 2.26 MB
Price: for free
HWiNFO32 is an information diagnostic utility that allows you to obtain detailed information about PC hardware and test the performance of the processor, memory and hard drives. The program is updated monthly - as a result, all new products that appear on the market are included in its database in a timely manner. There is a special portable edition of the utility that can be launched from a removable USB drive or other portable device.
Fresh Diagnosis 8.52
Developer: FreshDevices.com
Distribution size: 2.08 MB
Distribution method: freeware (http://www.freshdiagnose.com/download.html)
Price: free (registration required; tests cannot be used in the unregistered version)
Fresh Diagnose is an information diagnostic utility designed to obtain information about all hardware and software components of a PC, as well as testing it. The program is regularly updated and supports many modern models, but its shortcomings include a poorly designed interface and poor-quality Russian-language localization (therefore, it is wiser to use it with an English-language interface).
How to identify the components located inside the computer and view their parameters? How to check a processor or video card for performance and overheating? It is enough to use testing and diagnostic software.
Alternative programs: Catzilla, Unigine Superposition, Unigine Heaven, 3D Mark 11
PCMark is, in turn, a popular tool for checking the overall performance of a computer. The tests include, but are not limited to, applications such as office worksheet operations, 2D graphics operations, Internet browsing, and video conferencing.

In the latest version, however, they abandoned the media test (SSD or HDD). Only the Basic version is free.
If you want to check how your computer copes with the task of virtual reality and serves games designed for Oculus Rift or HTC Vive glasses, VR Mark will come in handy. As with other Futuremark programs, only the Basic version is free.

The tool is equipped with three tests, of which one is basic (Orange), for VR games using DirectX 12 (Cyan) and the most demanding ones (Blue).
Alternative program: SteamVR Performance Test
CPU-Z – for hardware identification
The main and most popular program for identifying processors, motherboards (including UEFI BIOS versions), memory (including SPD) or graphics cards. We get an accurate preview of the hardware data.

You can also test the processor in mono- and multi-threaded applications, and compare the results with other processors in the database. If you want to know what exactly is on your computer and how it works, this is the first application you should install.
Thanks to CPU-Z you can easily check, for example, at what frequency and delays the RAM operates, as well as the processor clock speed in real time. It is worth noting the fact that an Android version is available.
Alternative programs: Crystal CPU ID, Speccy
GPU-Z is the main program for identifying video cards and their characteristics, including their current frequency. A basic test is available in the application, which allows you to “quickly” verify that the video card is working correctly.

It is worth noting, however, that the test in this program will not give confidence that, for example, when overclocked, the video card will work completely stably. To do this, it is worth using more advanced products, for example, a stress test in the 3D-Mark program.
Alternative program: GPU Caps Viewer
Cinebench is a benchmark tool based on the Cinema 4D engine to test CPU performance. It does this by creating a 3D scene - the test can be run using all CPU threads or just one thread. This gives a good idea of the capabilities of the processors.

Cinebench also has a built-in graphics card test that uses a complex 3D scene that, using a car chase example (made by renderbaron), measures graphics card performance in OpenGL mode.
Alternative programs: LuxMark (3D graphics rendering using CPU or GPU), CompuBench (3D graphics rendering using GPU)
OCCT 4.5.1 – stability and temperature check
Alternative programs: FurMark, Prime95 or for temperature monitoring SpeedFan, RealTemp and CoreTemp.
MemTest86 is an excellent program for checking whether your RAM is working correctly. This is one of those components whose stable operation is very important for the performance of the computer.

The program runs from a bootable USB flash drive (or CD/DVD if someone else uses them).
Alternative program: Prime95
Prime95 – stability or temperature test under load
Another great program for testing the stability or temperatures of computer components under high load. We can choose between tests that load the most, for example, RAM or CPU.
Alternative programs: OCCT, MemTest86
It is difficult to point out one, the best program for checking the performance of storage media (HDD and SSD hard drives), but if you already have to do so, then CrystalDiskMark will be your favorite. It allows you to check the performance of media, both in the case of reading/writing sequential data and for small files.

It gives a good idea of the actual performance of the node being tested. If you are interested not only in performance (but, for example, also in SMART readings, the ability to download new firmware or perform Secure Erase operations), it is worth taking an interest in the applications included with the manufacturer's drives. For example, in the case of SanDisk, the SanDisk SSD Dashboard program is available, and in the case of Samsung, Samsung Magician is available.
Alternative programs: AS, AS SSD, manufacturer's programs included
Hi all. In today's article we will talk about a complete diagnosis of all devices in your computer. I will show and tell you how to independently diagnose a computer and all its component devices:
- HDD.
- RAM.
- Video card.
- Motherboard.
- CPU.
- Power unit.
We will check all this in this article and for each of the computer devices I will make a video in which I will clearly show how to diagnose a particular device.
In addition, using diagnostics, you will be able to determine whether you should completely replace the device or whether you can repair it; we will also analyze the main problems of devices that can be determined without diagnostics. Well, let's start with the most important question that interests everyone - HDD/SSD disk diagnostics.
HDD and SSD disk diagnostics.
Disk diagnostics are done in two directions: they check the Smart system of a hard or solid-state drive and check the disk itself for bad or slow sectors. In order to check the SMART HDD and SSD, we will use the program. You can download it from our website in the download section.
Well, now let’s go directly to the disk diagnostics itself, after downloading the program, run the file of the required bit depth and look at the main window; if you see a blue icon with the caption good or in English good, then everything is in order with your SMART disk and you don’t need to carry out further diagnostics.
If you see a yellow or red icon with the words carefully, bad, then there are some problems with your disk. You can find the exact problem below in the list of essential SMART diagnostic items. Wherever there are yellow and red icons opposite the inscription, it will indicate that it is in this part that your disk was damaged.
If your disk has already exhausted its lifespan, then there is no point in repairing it. If you have several broken sectors, then there is still a possibility of repair. I will talk about repairing bad sectors further. If there are many bad sectors on the disk, more than 10, or many very slow sectors, then it is not worth restoring such a disk. After some time, it will still crumble further, it will need to be constantly restored/repaired.
Software disk repair.
By repair I mean the relocation of bad and slow sectors on the disk. This instruction is only suitable for HDDs, that is, only hard drives. For an SSD, this operation will not help in any way, but will only worsen the condition of the solid-state drive.
Repairing will help extend the life of your hard drive a little more. To restore bad sectors we will use the HDD regenerator program. Download and run this program, wait until the program collects data about your drives, after the data has been collected you will see a window in which you will need to click on the inscription - Click here to bad sectors on demaget drive surfase directly under Windows XP, Vista, 7, 8 and 10. You need to click on the inscription quickly in OS 8 and 10, so the window will quickly disappear, in 7 everything is fine. Next, click NO. Then select your drive from the list. Click the start process button. A command line window will appear in which you will need to press 2, Enter, 1, Enter.
After the completed operations, the system will begin scanning for bad sectors and moving them to unreadable disk partitions. In fact, bad sectors do not disappear, but in the future they do not interfere with the operation of the system and you can continue to use the disk. The process of checking and restoring the disk may take a long time, depending on the size of your disk. When the program is finished, press button 5 and Enter. If you encounter any errors while testing and fixing bad sectors, it means that your disk cannot be recovered. If you have found more than 10 bads - bad sectors, then restoring such a disk does not make sense, there will always be problems with it.
The main signs of disk failure are:
Video on how to diagnose HDD/SSD:
RAM diagnostics
This time we will conduct diagnostics of RAM. There are several options in which you can check the RAM, this is when your computer is still turning on and working somehow, and when you can no longer turn on the computer, Only the BIOS loads.
The main signs that the RAM is not working:
- When loading resource-intensive applications, the computer freezes or restarts.
- When using the computer for a long time, more than 2 hours, Windows begins to slow down, and as time increases, the slowdown increases.
- When installing any programs, you cannot install them, the installation fails with errors.
- Sound and video jamming.
The first thing we will look at is how to check the RAM if your Windows boots. It’s very simple, in any operating system starting with Windows Vista you can type the Windows memory checker in the search. The shortcut that appears is launched as administrator and we see a message stating that you can reboot and start the scan right now or schedule a scan the next time you turn on the computer. Select the value you need. After the computer restarts, the RAM test will immediately automatically start. It will be carried out in standard mode, wait until the end of the test and you will find out if everything is okay with your RAM. In addition, after you have already loaded Windows, in the event viewer you can open the Windows logs, select the System item and find the memory diagnostic event in the list on the right. In this event you will see all the information about the diagnostics performed. Based on this information, you can find out whether the RAM is working.
The next option for diagnosing RAM if you cannot boot Windows. To do this, you need to write the program to a disk or bootable USB flash drive and run it from the BIOS. In the window that appears, a test to check random access memory (RAM) will be automatically launched. Wait until the test is completed and if there are any problems with your memory, the test window will change from blue to red. This will indicate defects or failure of the RAM. That's all, you have learned how to diagnose RAM.
Video on how to check the RAM:
Video card diagnostics
The main signs of a video card defect:
- The computer hits the blue screen of death.
- Artifacts appear on the screen - multi-colored dots, stripes or rectangles.
- When loading games, the computer freezes or restarts.
- When using a computer for a long time in a game, performance decreases and the game begins to lag.
- Video jamming, video playback failure, problems with flash player.
- No smoothing in text or when rewinding documents or web pages.
- Changing the color scheme.
All these are signs of some kind of video card defect. Testing a video card should be divided into two stages: checking the graphics chip and checking the video card memory.
Checking the graphics chip of the video card (GPU)
To check the graphics chip, you can use various programs that put a load on this chip and identify failures under critical load. We will use the program, and FurMark.
Launch Aida at the bottom of the tray near the clock, right-click and select system stability test. In the window that appears, check the box next to GPU Stress Test. The test will be launched below and you will see a graph of temperature changes, fan speed, and current consumption. To check, a 20-minute test is enough; if at this time the lower field with the graph turns red or the computer reboots, then there are problems with your video card.
Let's launch OCCT. Go to the GPU 3D tab, do not change the settings and press the ON button. Next, a window will appear with a furry donut, which is a visual test. The test will take 15-20 minutes. I recommend monitoring the temperature and monitoring the power readings; if multi-colored dots, stripes or rectangles appear on the screen, this will indicate that there is a problem with the video card. If the computer turns off spontaneously, this will also indicate a defect in the video card.
Now we have analyzed the diagnostics of the video card processor, but sometimes there are also problems with the video card memory.
Diagnostics of video card memory
For this diagnostic we will use the program. Unpack the program and run it as administrator. In the window that appears, put a checkmark next to the inscription signal if there are errors and press the start button. A check of the video card's RAM will be launched; if any errors are detected with the memory, the program will emit a characteristic sound signal; on some computers the signal will be a system one.
That's all, now you can diagnose the video card yourself. Check the GPU and video card memory.
Video card testing video:
Motherboard diagnostics
The main signs of a motherboard malfunction:
- The computer hits the blue screen of death, reboots and turns off.
- The computer freezes without rebooting.
- The cursor, music and video (freezes) get stuck.
- Connected devices disappear - HDD/SSD, drive, USB drives.
- Ports, USB and network connectors do not work.
- The computer does not turn on, does not start, does not boot.
- The computer works slowly, often slows down or freezes.
- The motherboard makes various sounds.
Visual inspection of the motherboard
The first thing you need to do to diagnose a motherboard is to conduct a visual inspection of the motherboard. What you need to pay attention to:
- Chips and cracks - if such damage is present, the motherboard will not turn on at all or will turn on only once.
- Swollen capacitors - due to swollen capacitors, the computer can turn on after 3, 5, 10 attempts or after a certain time, it can also go out for no reason and slow down.
- Oxidation - the computer may turn on every once in a while and slow down. It may not turn on at all if the tracks are completely oxidized.
- Warmed up chips, there will be small burnt spots or holes on the microchips - because of this, the computer may not turn on or the ports, network cards, sound or USB will not work.
- Scratches on paths are the same as with chips and cracks.
- Burnt around chips and ports leads to complete inoperability of the motherboard or its individual parts.
Software diagnostics of the motherboard
If your computer turns on and boots into Windows, but there are strange glitches and slowdowns, it’s worth doing software diagnostics of the motherboard using the program. Download and install the program, launch it, right-click on its icon at the bottom of the tray near the clock and select “service” - “system stability test”. Check the boxes next to Stress CPU, Stress FPU, Stress cache, and uncheck the rest. Press the "Start" button, the computer will freeze, and the test will begin. During the test, monitor the temperature of the processor and motherboard, as well as power. We carry out the test for a minimum of 20 minutes and a maximum of 45 minutes. If during the test the bottom field turns red or the computer turns off, then the motherboard is faulty. Also, the shutdown may be due to the processor, uncheckStress CPU and check again. If you find overheating, then you need to check the cooling system of the motherboard and processor. If the power supply fluctuates, problems may occur with both the motherboard and the power supply.
If the computer starts but Windows does not load, you can check the mainland through a boot test. It needs to be written to a disk or flash drive. I will show you in more detail how to use it in the video.
Diagnostics of the power supply unit (PSU)
The main signs of a faulty power supply:
- The computer does not turn on at all.
- The computer starts for 2-3 seconds and stops working.
- The computer turns on 5-10-25 times.
- When under load, the computer turns off, reboots, or displays a blue screen of death.
- When under load, the computer slows down a lot.
- Devices connected to the computer spontaneously disconnect and connect (screws, drives, USB devices).
- Squeak (whistle) when the computer is running.
- Unnatural noise from the power supply fan.
Visual inspection of power supply unit
The first thing to do if the power supply is faulty is to do a visual inspection. We disconnect the power supply from the case and disassemble the power supply itself. We check for:
- Burnt, melted elements of the power supply unit - make sure that all the elements are intact; if you find burning or something obviously melted, we take the power supply unit for repair or replace it with a new one.
- Swollen capacitors - replace swollen capacitors with new ones. Because of them, the computer may not turn on the first time or may die under load.
- Dust - if dust is clogged in the fan and radiators, it must be cleaned, because of this the power supply under load may turn off due to overheating.
- Burnt fuse - when there is a voltage drop, the fuse often burns and needs to be replaced.
We checked everything but the power supply is behaving badly, let's see.
Software diagnostics of power supply
Software diagnostics of the power supply can be carried out using any test program that gives the maximum load on the power supply. Before doing such a check, you need to determine whether all elements of your PC have enough power from the power supply. You can check this like this: run the AIDA 64 program link above and go to the site for calculating the required power of the power supply. On the website, we transfer the data from Aida to the appropriate fields and click the Calculate button. This way we will be sure exactly how much power the power supply will be enough for the computer.
Let's proceed to the diagnosis of PD itself. Download the program. We install and launch it. Go to the Power Supply tab. Check the box to use all logical cores (does not work on all computers) and press the ON button. The test lasts an hour, and if during this time the computer turns off, reboots, or displays a blue screen, there are problems with the power supply (Before checking the power supply, you must first check the video card and processor to avoid the test being incorrect).
I won’t show you how to diagnose a power supply with a multimeter, because there is a ton of this information on the Internet, and it’s better for professionals to do such diagnostics. I will show you testing the power supply in more detail in the video below:
Hello.
When working at a computer, sometimes various kinds of failures and errors occur, and getting to the bottom of the reason for their occurrence without special software is not an easy task! In this help article, I want to post the best programs for testing and diagnosing PCs, which will help in solving a wide variety of problems.
By the way, some of the programs can not only restore the computer’s functionality, but also “kill” Windows (you will have to reinstall the OS), or cause the PC to overheat. Therefore, be careful with such utilities (it’s definitely not worth experimenting without knowing what this or that function does).
CPU testing
Rice. 1. CPU-Z main window
A free program for determining all the characteristics of a processor: name, core type and stepping, socket used, support for certain multimedia instructions, cache memory size and parameters. There is a portable version that does not require installation.
By the way, processors of even the same name can be slightly different: for example, different cores with different steppings. Some information can be found on the processor cover, but usually it is hidden far away in the system unit and is not easy to get to.
Another important advantage of this utility is its ability to create a text report. In turn, such a report can be useful when solving a wide variety of problems with a PC problem. I recommend having such a utility in your arsenal!
One of the most frequently used utilities, at least on my computer. Allows you to solve a wide range of problems:
Control over startup (removing everything unnecessary from startup);
Monitor the temperature of the processor, hard drive, video card;
Obtaining summary information on the computer and any of its hardware in particular. This information can be indispensable when searching for drivers for rare hardware:
In general, in my humble opinion, this is one of the best system utilities, containing everything you need. By the way, many experienced users are familiar with the predecessor of this program - Everest (by the way, they are very similar).
One of the best programs for testing the performance of a computer's processor and RAM. The program is based on complex mathematical calculations that can completely and permanently load even the most powerful processor!
By the way, the program works in all popular Windows operating systems today: XP, 7, 8, 10.
Temperature monitoring and analysis
Temperature is one performance indicator that can say a lot about the reliability of a PC. The temperature is usually measured for three PC components: the processor, the hard drive and the video card (they are the ones that most often overheat).
By the way, the AIDA 64 utility measures the temperature quite well (about it in the article above, I also recommend this link:).
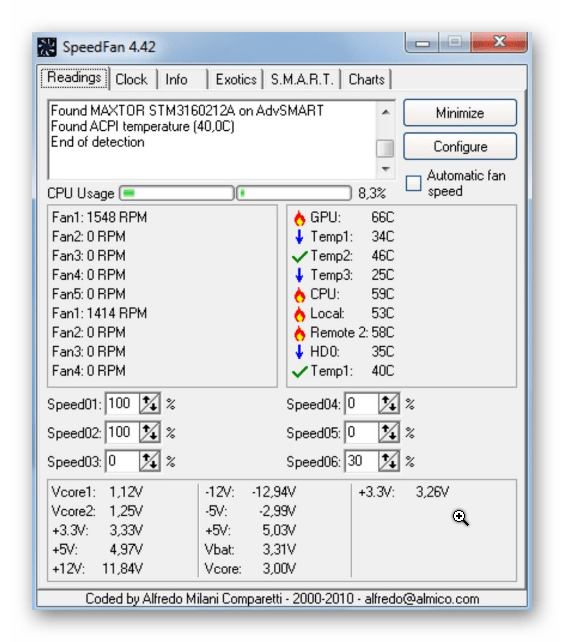
SpeedFan
This small utility can not only monitor the temperature of the hard drives and processor, but also help adjust the rotation speed of the coolers. On some PCs they make a lot of noise, thereby irritating the user. Moreover, you can reduce their rotation speed without harming the computer (adjusting the rotation speed is recommended for experienced users, This operation may cause your PC to overheat!).
Core Temp
A small program that measures temperature directly from the processor sensor (bypassing unnecessary ports). The accuracy of the readings is one of the best of its kind!
Programs for overclocking and monitoring video card performance
By the way, for those who want to speed up a video card without using third-party utilities (i.e., no overclocking and no risks), I recommend reading the articles on fine-tuning video cards:
Rice. 6. Riva Tuner
A once very popular utility for fine-tuning Nvidia video cards. Allows you to overclock an Nvidia video card both through standard drivers and “directly”, working with hardware. That is why you should work with it carefully, without going too far with the parameter settings (especially if you have not yet had experience working with such utilities).
Also, quite well, this utility can help with settings for resolution (locking it, useful in many games), frame rate (not relevant for modern monitors).
By the way, the program has its own “basic” driver and registry settings for certain work cases (for example, when starting a game, the utility can switch the video card operating mode to the required one).
Rice. 7. ATITool - main window
A very interesting program for overclocking ATI and nVIDIA video cards. It has automatic overclocking functions, and also has a special algorithm for “loading” the video card in three-dimensional mode (see Fig. 7, above).
When testing in three-dimensional mode, you can find out the number of FPS produced by the video card with one or another fine tuning, and also immediately notice artifacts and defects in the graphics (by the way, this moment means that it is dangerous to overclock the video card further). In general, an indispensable tool when trying to overclock a graphics adapter!
Recovering information if accidentally deleted or formatted
Quite a large and extensive topic that deserves a whole separate article (and more than one). On the other hand, it would be wrong not to include it in this article. Therefore, here, in order not to repeat myself and not to increase the size of this article to “huge” sizes, I will only provide links to my other articles on this topic.
Recovering Word documents -
Determining a malfunction (primary diagnosis) of a hard drive by sound:
A huge directory of the most popular data recovery programs:
Testing RAM
Also, the topic is quite extensive and cannot be described in a few words. Typically, if there are problems with RAM, the PC behaves as follows: freezes, “ ” appears, spontaneous reboot, etc. For more details, see the link below.
Hard drive analysis and testing
Analysis of the occupied space on the hard drive -
Hard drive slows down, analysis and search for reasons -
Checking the hard drive for functionality, searching for bad problems -
Cleaning your hard drive from temporary files and junk -
That's all for me today. I would be grateful for additions and recommendations on the topic of the article. Good luck with your PC.
Every year, an increasing number of computer diagnostic programs are released. But an even greater number of users are purchasing PCs and want to make sure that the components, painstakingly found on the dusty shelves of online stores, fully satisfy all their requirements. It is no less difficult to manage without programs of this kind in everyday use of a computer. Many of them allow you not only to diagnose problems, but also to keep your PC’s health under control.
There are a number of programs, the capabilities of which are expanding from year to year, while the product becomes complex for an inexperienced user, and the price increases several times. There are also analogue programs that have a slightly less meager arsenal of capabilities, but are worth nothing. We will get acquainted with the most polar representatives of both categories among users in this review.
AIDA64, without exaggeration, is the most popular product for review, as well as diagnostics of a personal computer in general. The program can provide the most complete information about any component of a working machine: components, programs, operating system, network connections and external devices. Over many years of excellence in the market, it acquired AIDA64 and a whole range of utilities for diagnosing PC stability and testing its performance. Easy to learn thanks to a simple and friendly interface.

Everest was once a very popular analyzer of computer hardware and software components. Allows you to find out comprehensive data about the system, which would be very difficult to obtain otherwise. Developed by Lavalys, the program was a follower of AIDA32. In 2010, the rights to develop this product were purchased by another company. In the same year, the development of Everest itself was stopped, and AIDA64 was eventually introduced on its basis. But even after so many years, Everest is still a relevant and beloved product by many users.

S.I.W.
System Info For Windows is a utility that provides the user with an easy-to-setup and easy-to-use tool that allows you to view detailed data on the configuration of PC hardware and hardware, installed software, system components, and network elements. With its functionality, the SIW product is in close competition with AIDA64. However, there are also differences between them. Although System Info For Windows cannot boast such powerful resources for PC diagnostics, it has a number of its own, no less useful tools.

System Explorer
The System Explorer utility is completely free and in its likeness is an analogue of the classic Windows OS task manager. It helps monitor computer operation in real time and manage its processes. The utility has a built-in database that can be used to check any of the processes running on the user’s computer for malicious information. The interface is correctly translated into Russian, divided into tabs, each of them is responsible for specific tasks. Understanding the operation of the System Explorer utility is not difficult even for an inexperienced user.

PC Wizard
PC Wizard is a powerful program that provides information about the operation of the motherboard, processor, video card and a number of other computer components. What sets this product apart from a number of similar products is a series of tests that allow you to determine the performance and overall performance of the system. PC Wizard's interface is minimalistic and it's very easy to understand. The program is widely known among users due to its free distribution. And although the developer stopped supporting it in 2014, even today it can be a good assistant in assessing the potential of a PC.

SisSoftware Sandra
The SisSoftware Sandra program is a collection of useful utilities that will assist in diagnosing the system, installed programs, codecs and drivers. Sandra also has the functionality of providing information about various system components. You can even perform diagnostic operations on devices remotely. The software product, with such a large functionality, is completely easy to use, which was achieved thanks to an intuitive interface, as well as high-quality Russian translation. SisSoftware Sandra is distributed according to a paid model, but you can evaluate all its advantages during the trial period.

The 3DMark product belongs to Futuremark, one of the main players in the testing package market. They are not only visually very attractive and varied, but also always give a stable, repeatable result. The company's close cooperation with global manufacturers of processors and graphics cards allows it to competently improve its product. The tests included in the 3DMark package are used both to test the strength of weak machines, such as laptops, and the most advanced and powerful PCs. There are a number of tests for mobile platforms, for example, Android and iOS, which allows you to compare the real graphics or processing power of a particular smartphone.

No matter how powerful and advanced the components of modern computers are, their owners still try to improve, strengthen or overclock something. A good assistant for them in this will be the SpeedFan program, which, in addition to providing information about the entire system, will also allow you to edit some characteristics. By skillfully using this product, you can optimally configure the operation of coolers if they do not cope with their task of cooling the processor and motherboard, or, on the contrary, they begin to work actively when the temperature of the components is still in an optimal state. Only experienced users will be able to fully work with the program.
OCCT
Even an experienced Windows OS user may sooner or later encounter an unexpected problem that causes the computer to malfunction. The cause of the problem may be overheating, overload or mismatch of components. To identify them, you need to use specialized software. OCCT belongs to the category of such products. Thanks to a series of tests of PC components, the program can detect sources of malfunctions or prevent their occurrence. There are also real-time monitoring capabilities of the system. The interface is non-standard, but convenient, and also Russified.

S&M
A small and completely free program from a domestic developer is a set of tests for loading computer components. The ability to monitor the testing process allows you to track in real time possible problems with overheating or insufficient power of the power supply, as well as determine the overall performance of the processor, RAM and the speed of hard drives. The program's simple interface and detailed description of test settings will allow even a beginner to test the PC's strength.

In order for a computer to function reliably and smoothly, it is necessary to diagnose all possible failures and malfunctions in its operation in a timely manner. The programs presented in this review can help with this. It is difficult to choose one product for yourself, even one that tries to be as universal as possible. Each tool has both its advantages and disadvantages, but they all cope equally well with their priority tasks.